Toggle navigation
Home
▼ Details
Products and pricing
Chart gallery
User stories
Text analytics
CDC NAMCS Library
Blog
Tutorials
Contact
Sign in
Tutorials
Search results for “
”
New to Protobi?
Sign into Protobi
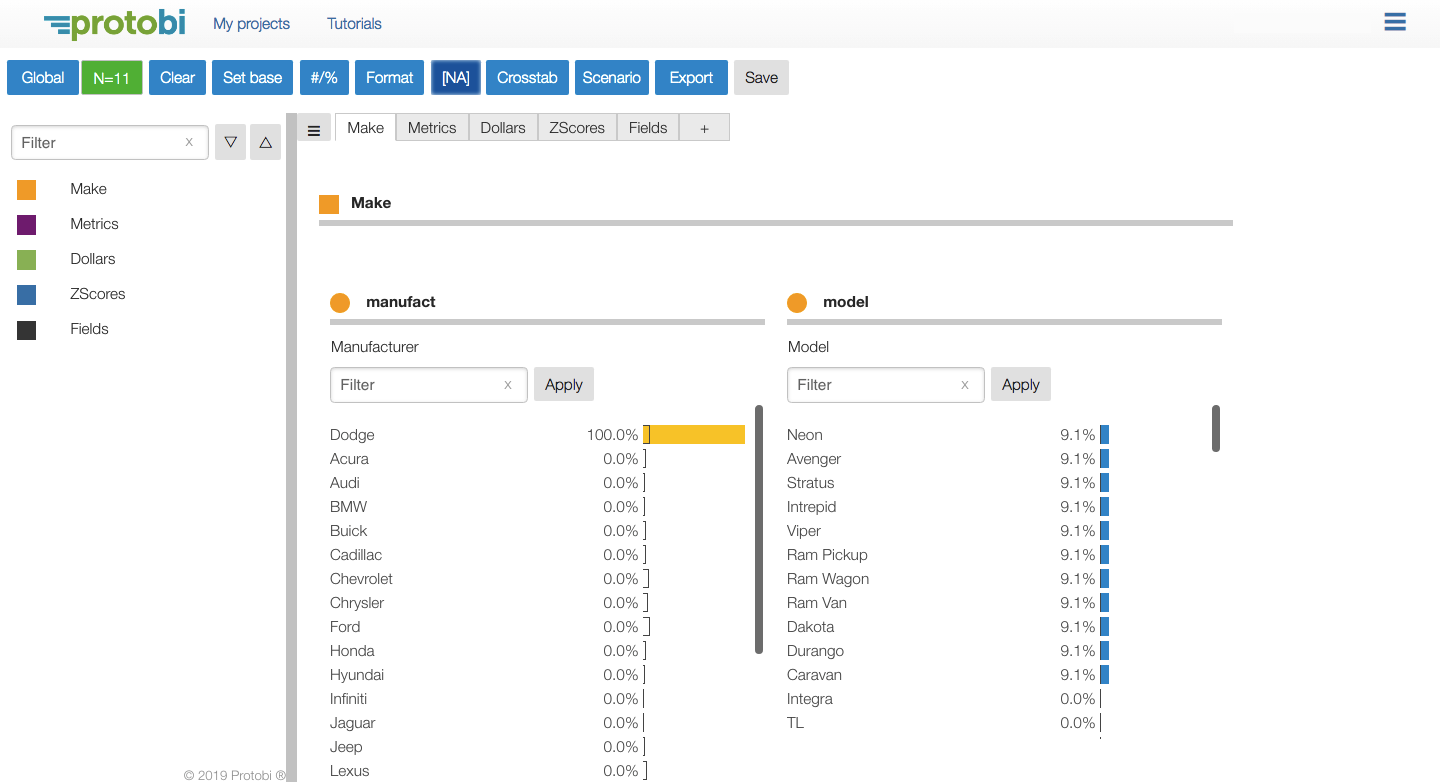
Intro to Protobi
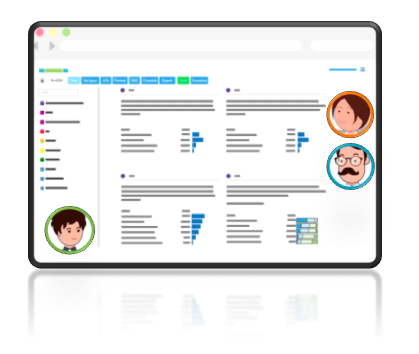
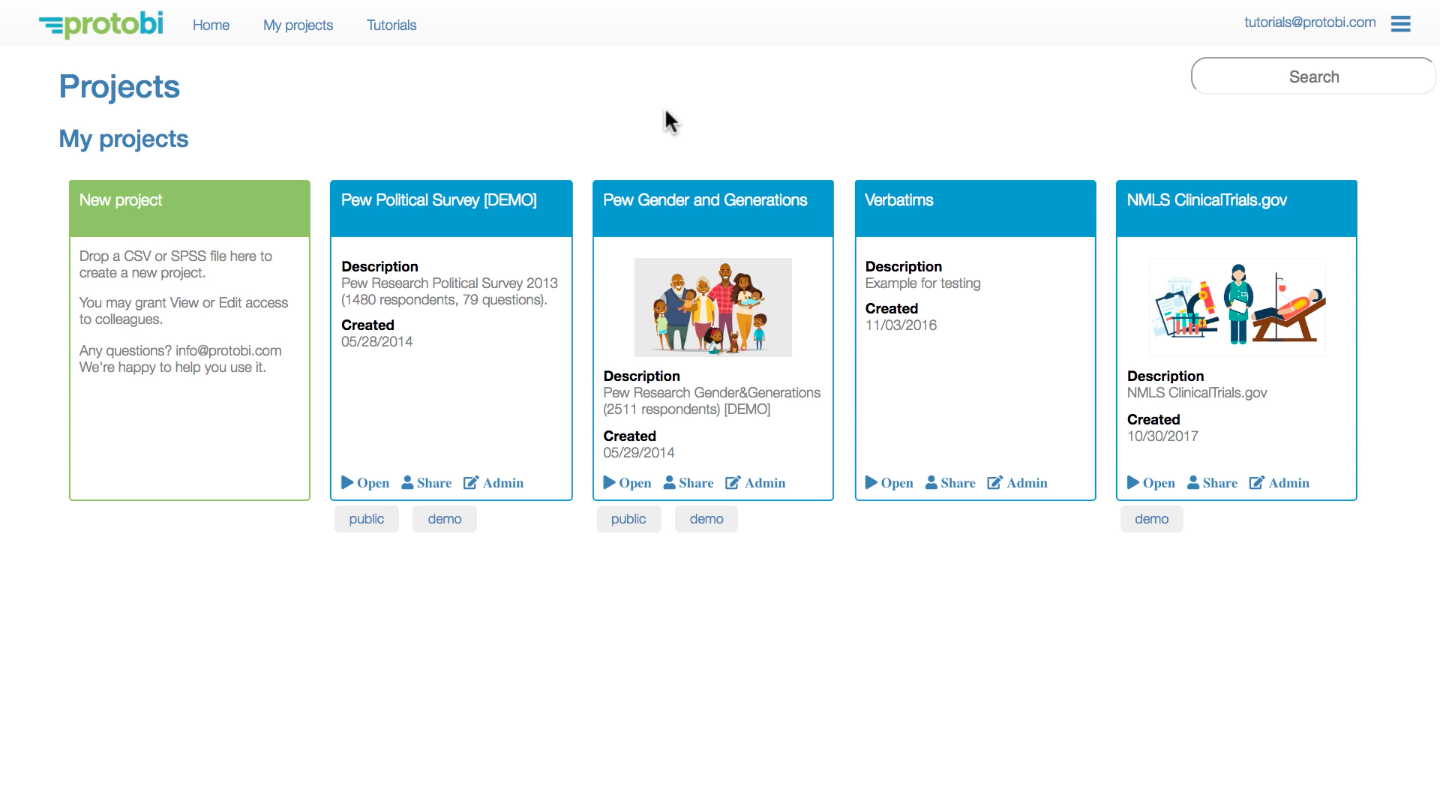
Protobi project management
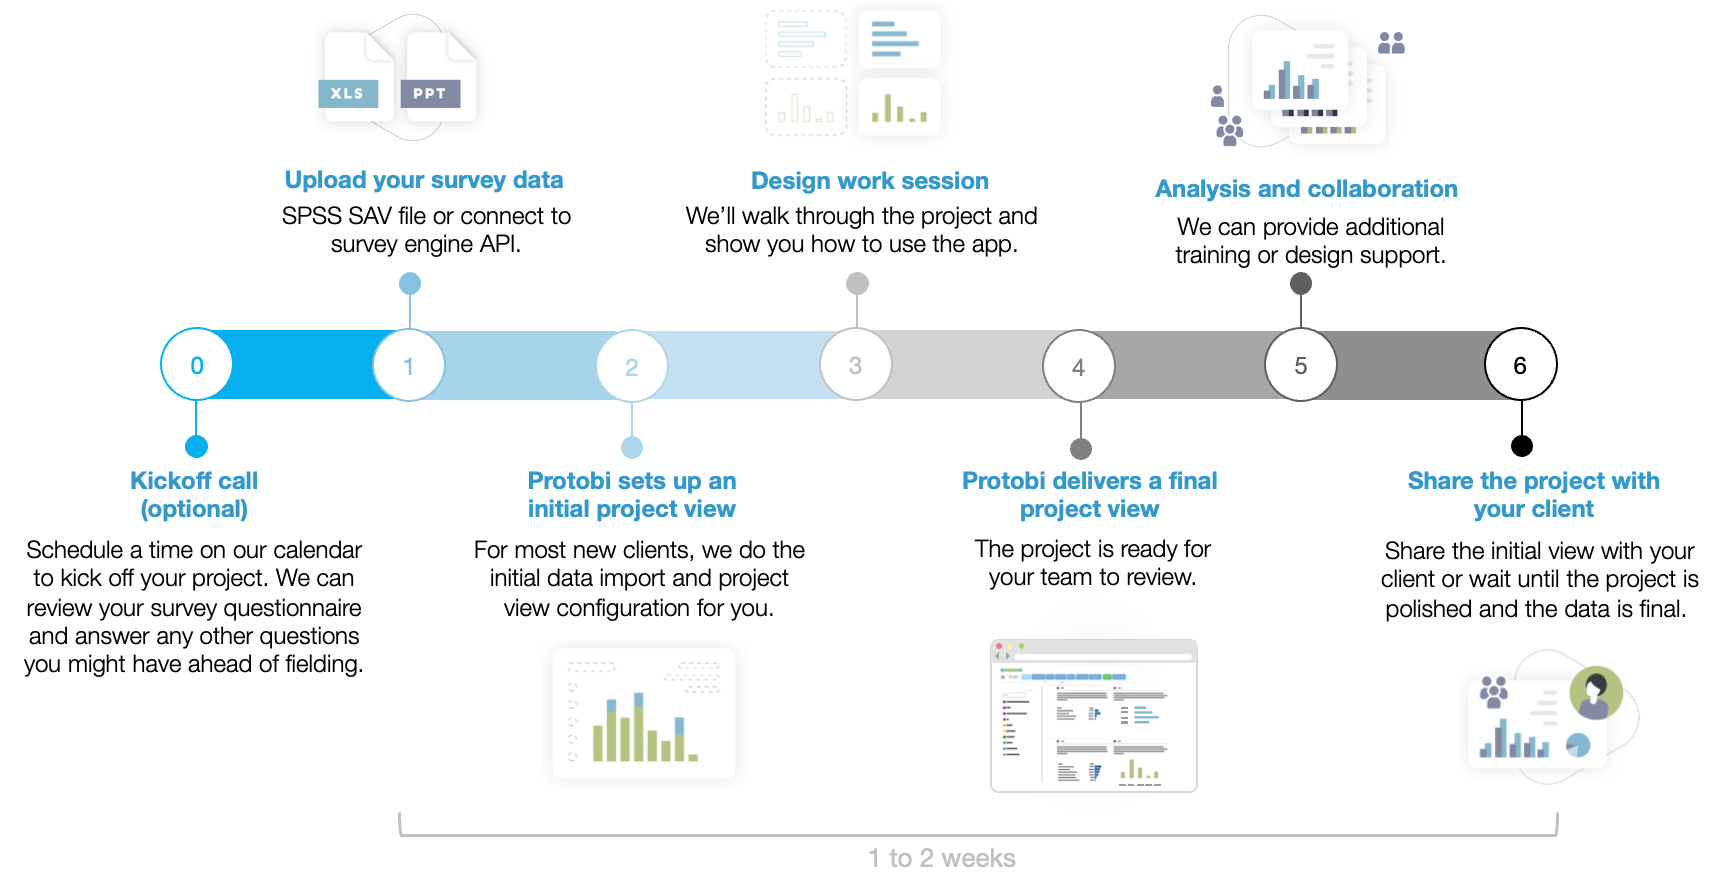
Project flow
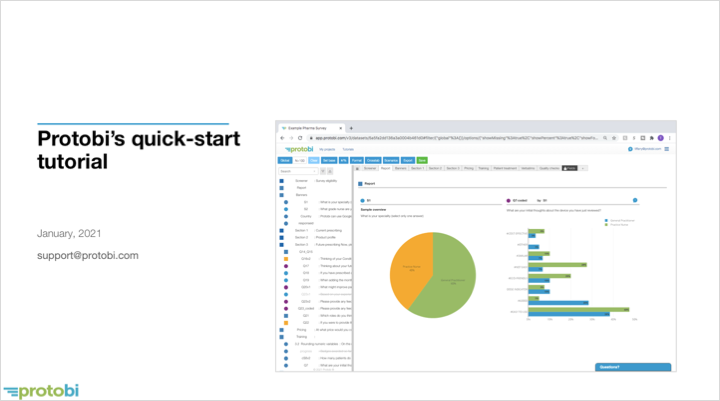
Protobi quick-start tutorial (slides)
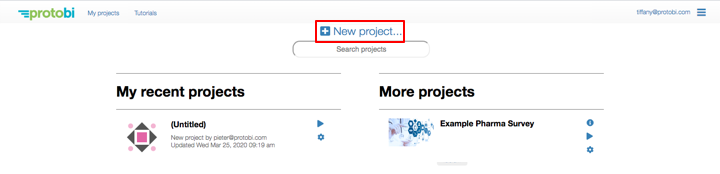
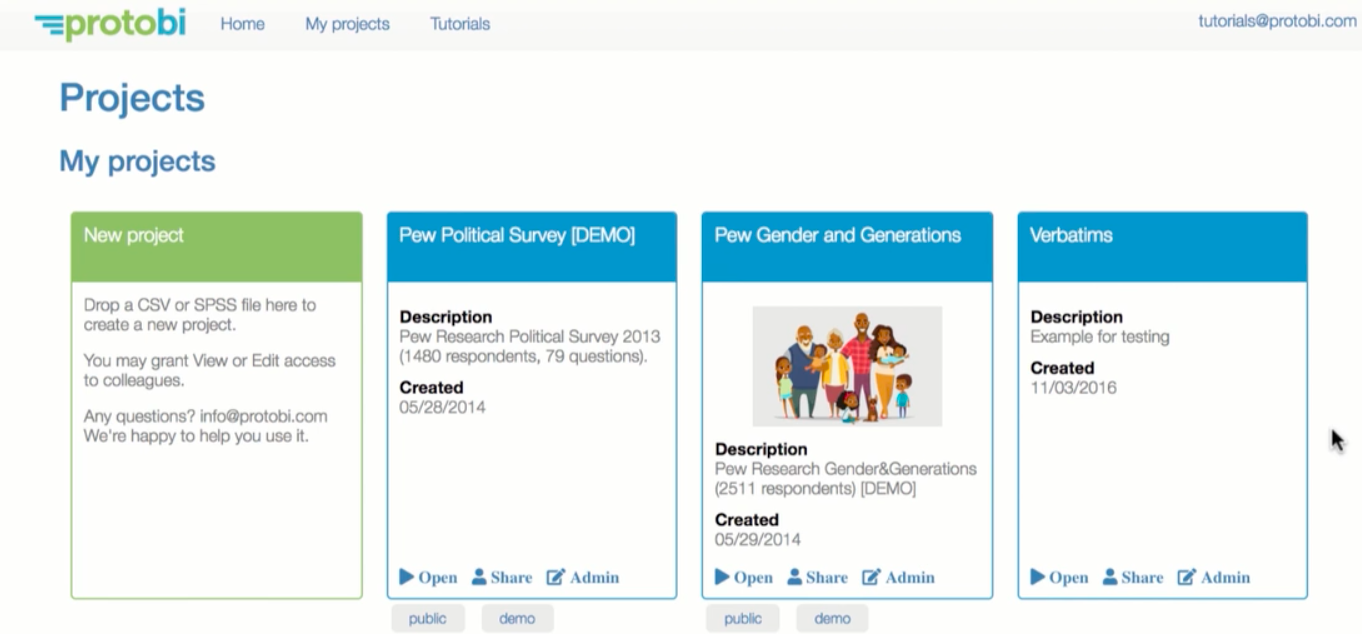
Create a new project
Initial design work session
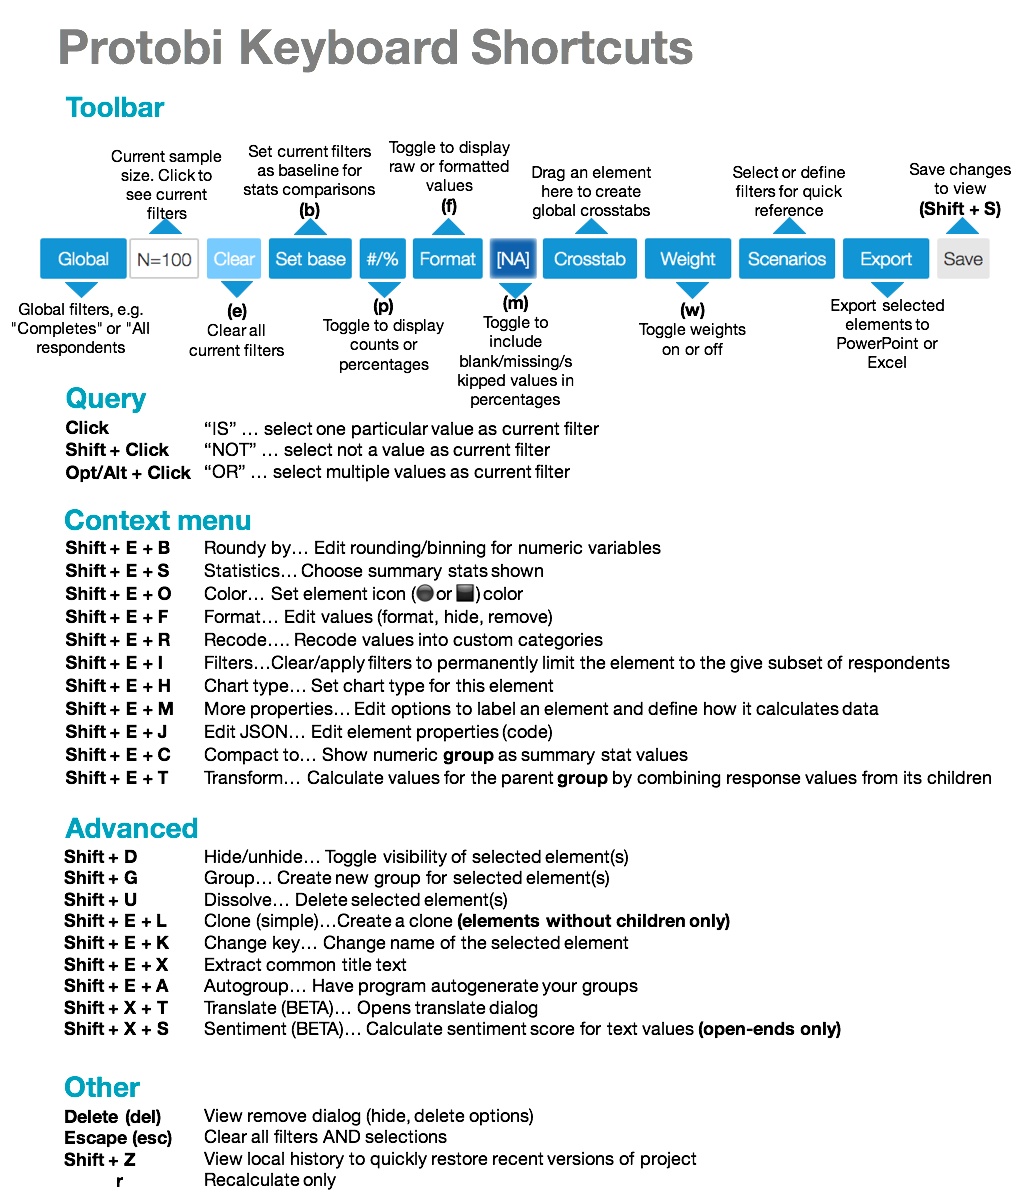
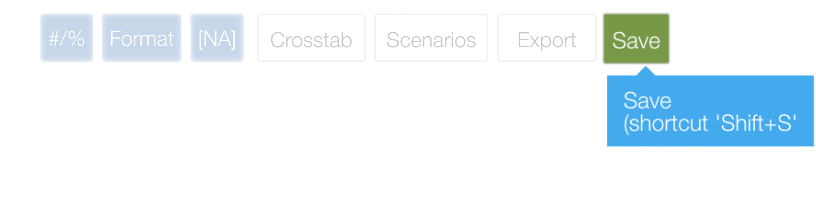
Toolbar shortcuts cheat sheet
Learning with Protobi tutorials
Basic navigation in Protobi
Basic project setup
Tips to save analysts time with Protobi
Intro to Protobi
Editor Panel
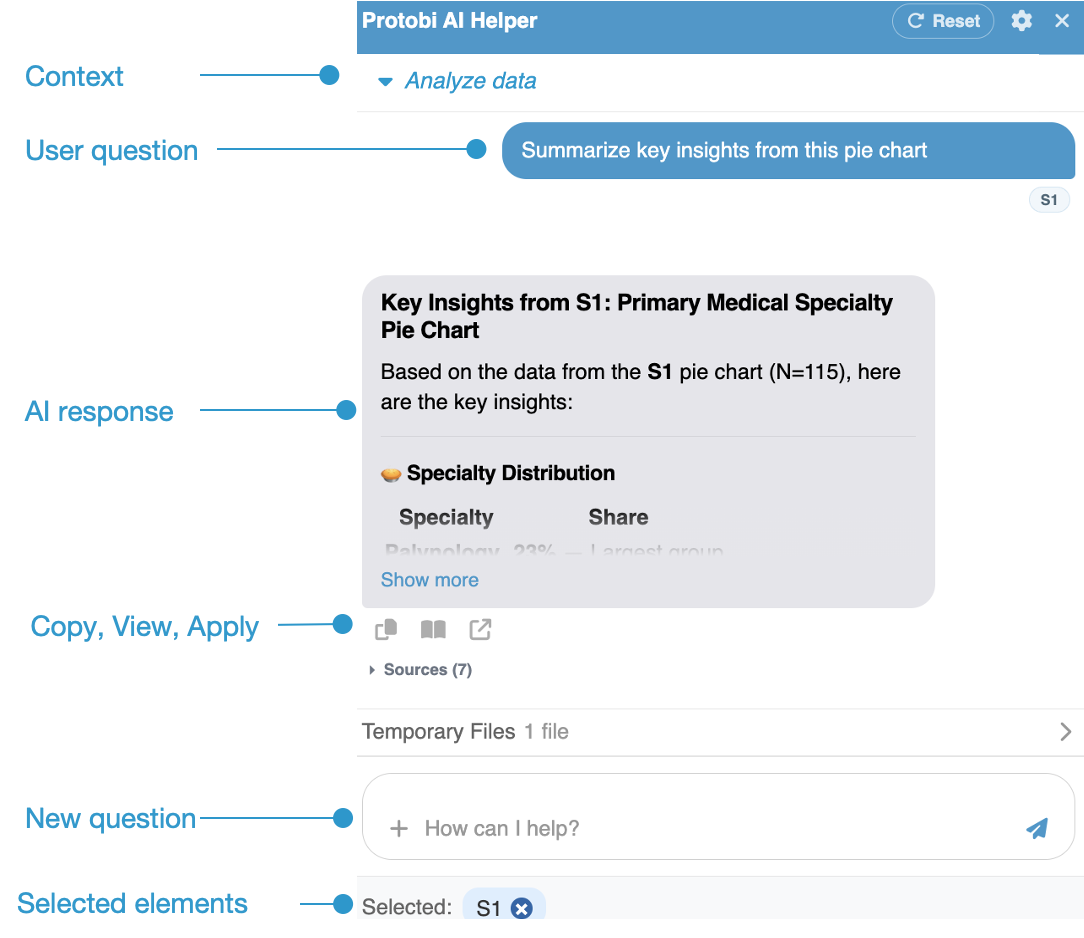
Protobi AI Helper
Organizing the view
Move, mirror, clone to organize the view
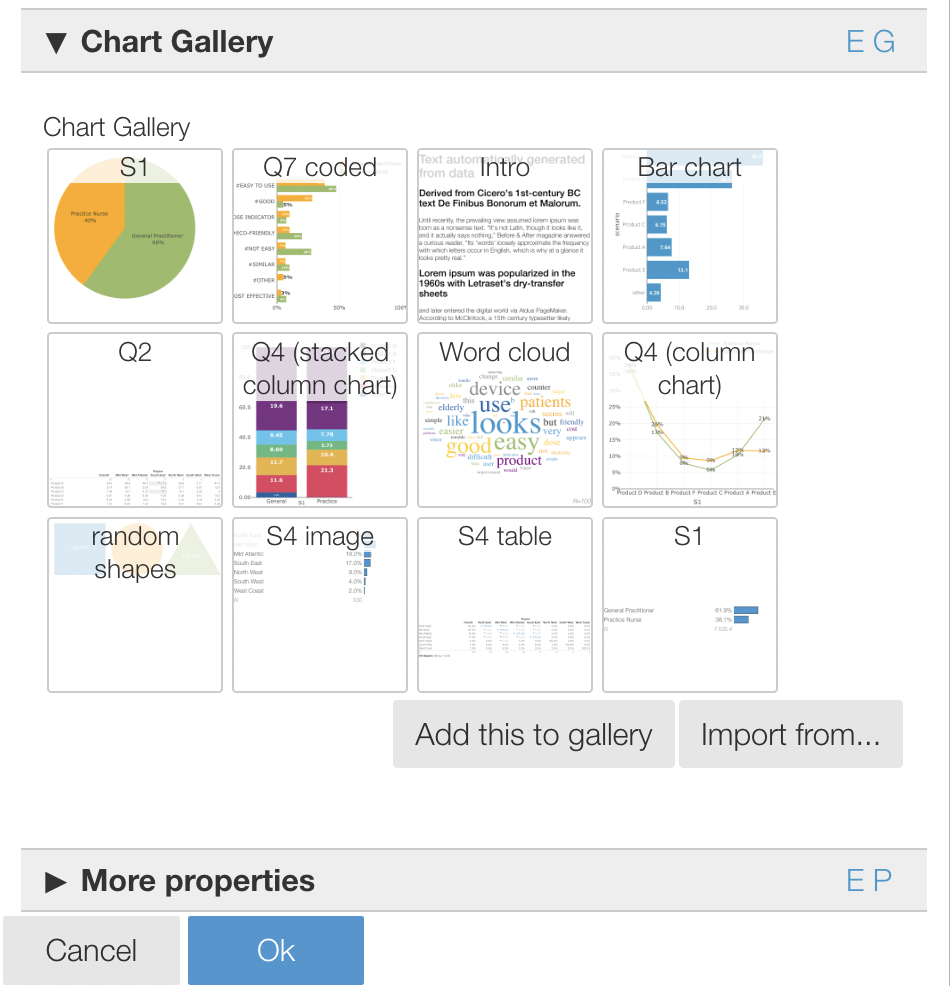
Chart gallery: save preset chart templates
New and updated articles
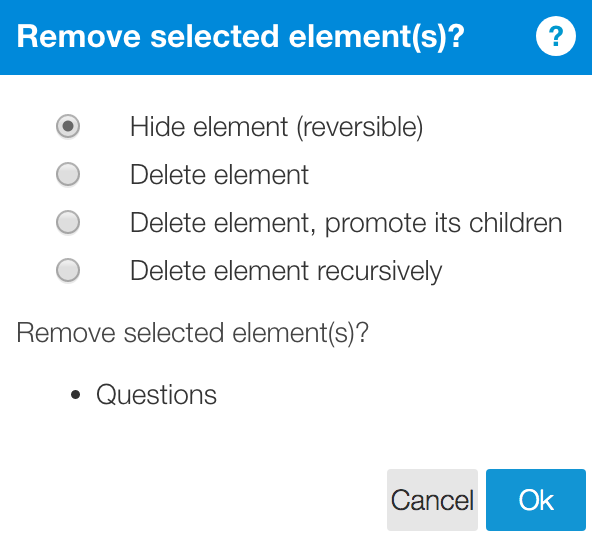
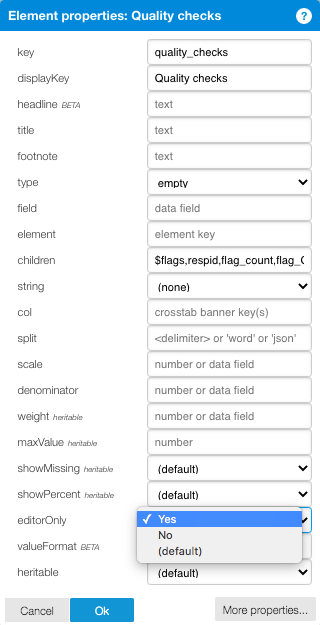
Protect elements from deletion
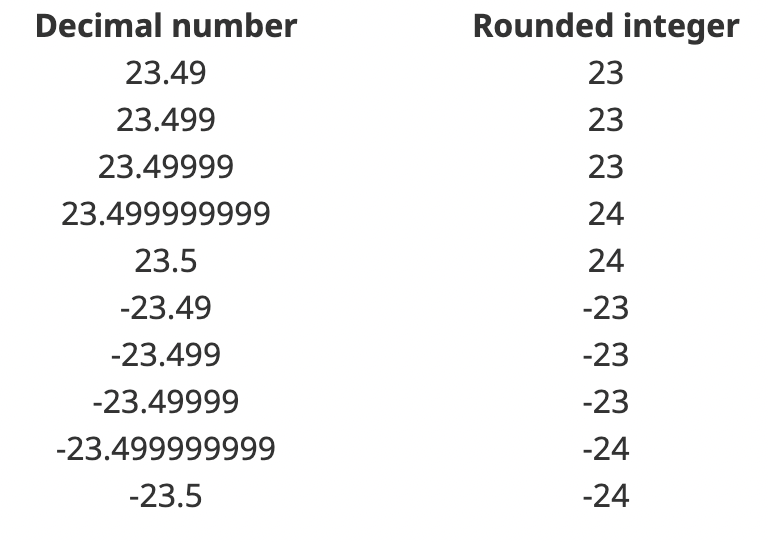
How Protobi rounds raw and calculated values
Edit multiple elements at once
See and edit data for charts in table view
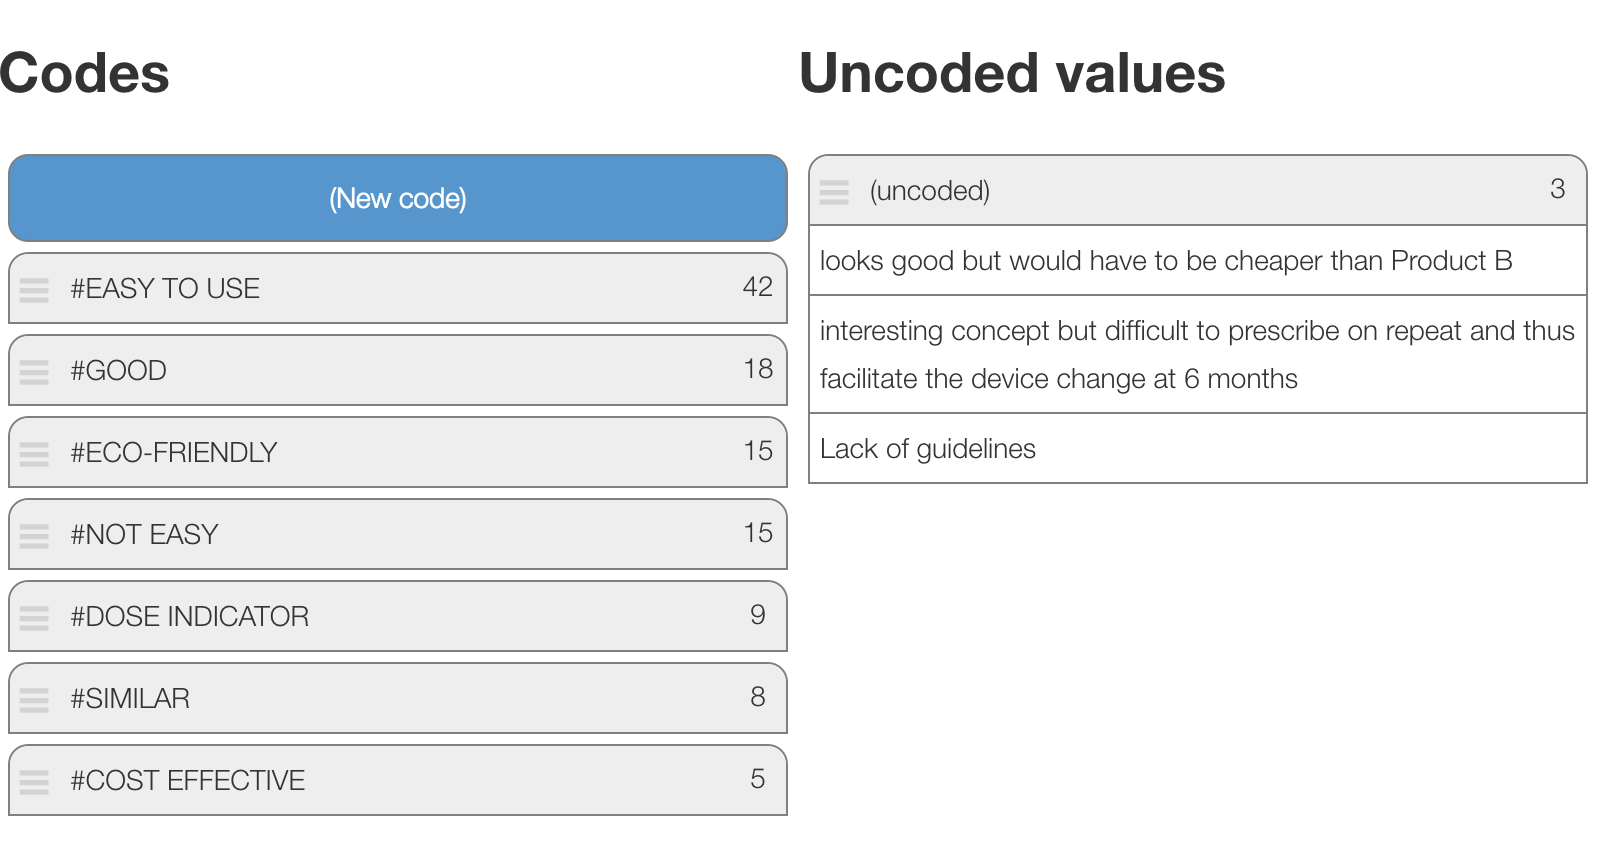
Tips for open-end recoding
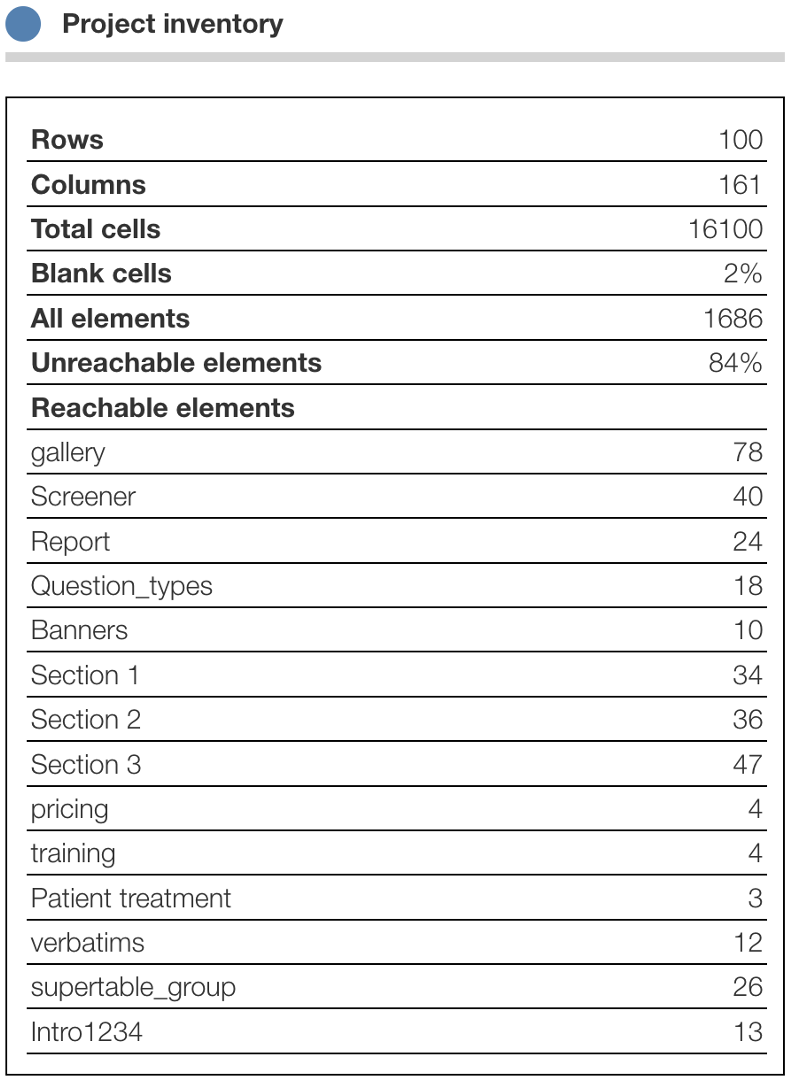
Count elements, data columns and rows in a project
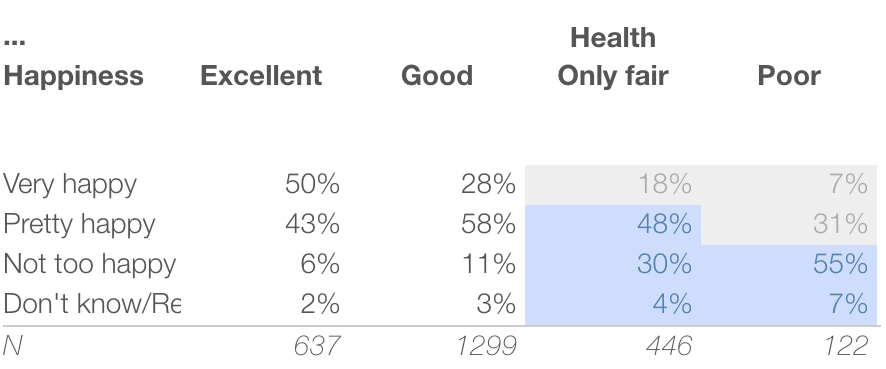
Create and export stylized crosstab tables
Protobi AI Helper
Basics for viewers
Press to query
Baseline data
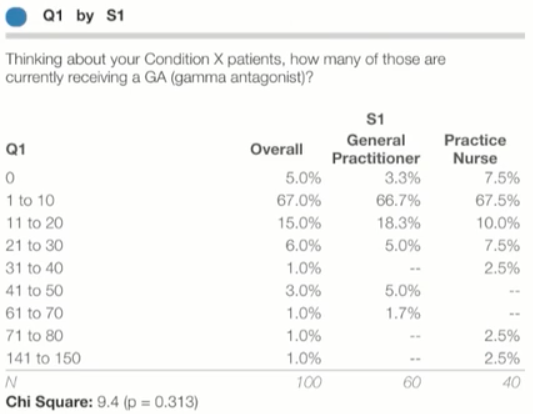
Crosstabs
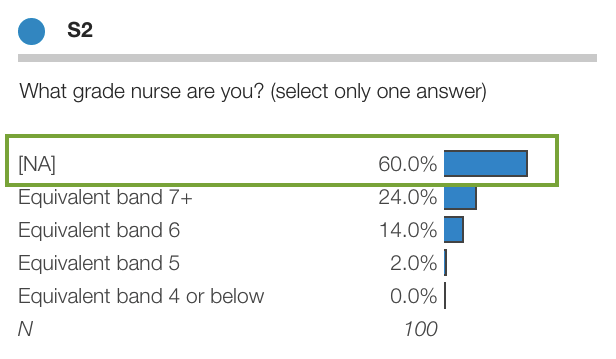
Blank, skipped, and missing values
Global filters
Scenarios
Export data
Sorting responses
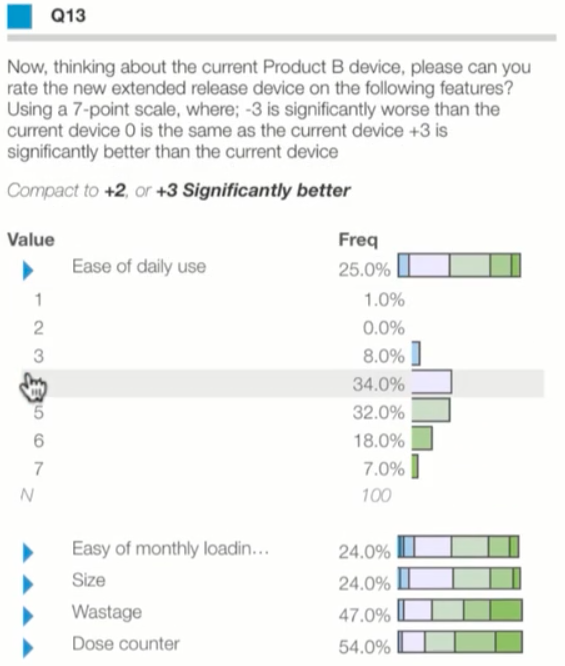
Display top box scores
Create multiple versions of your chart filtered on banner values
Editor Panel
Basics for editors
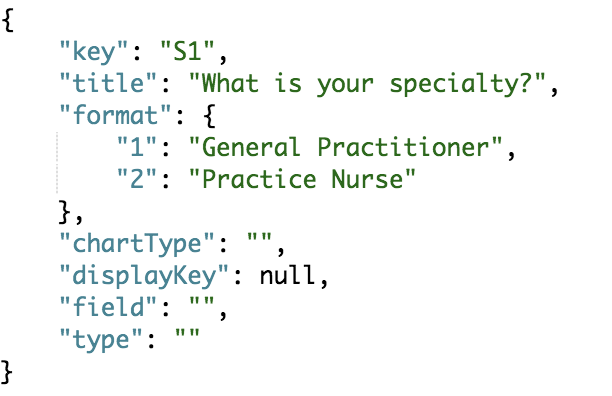
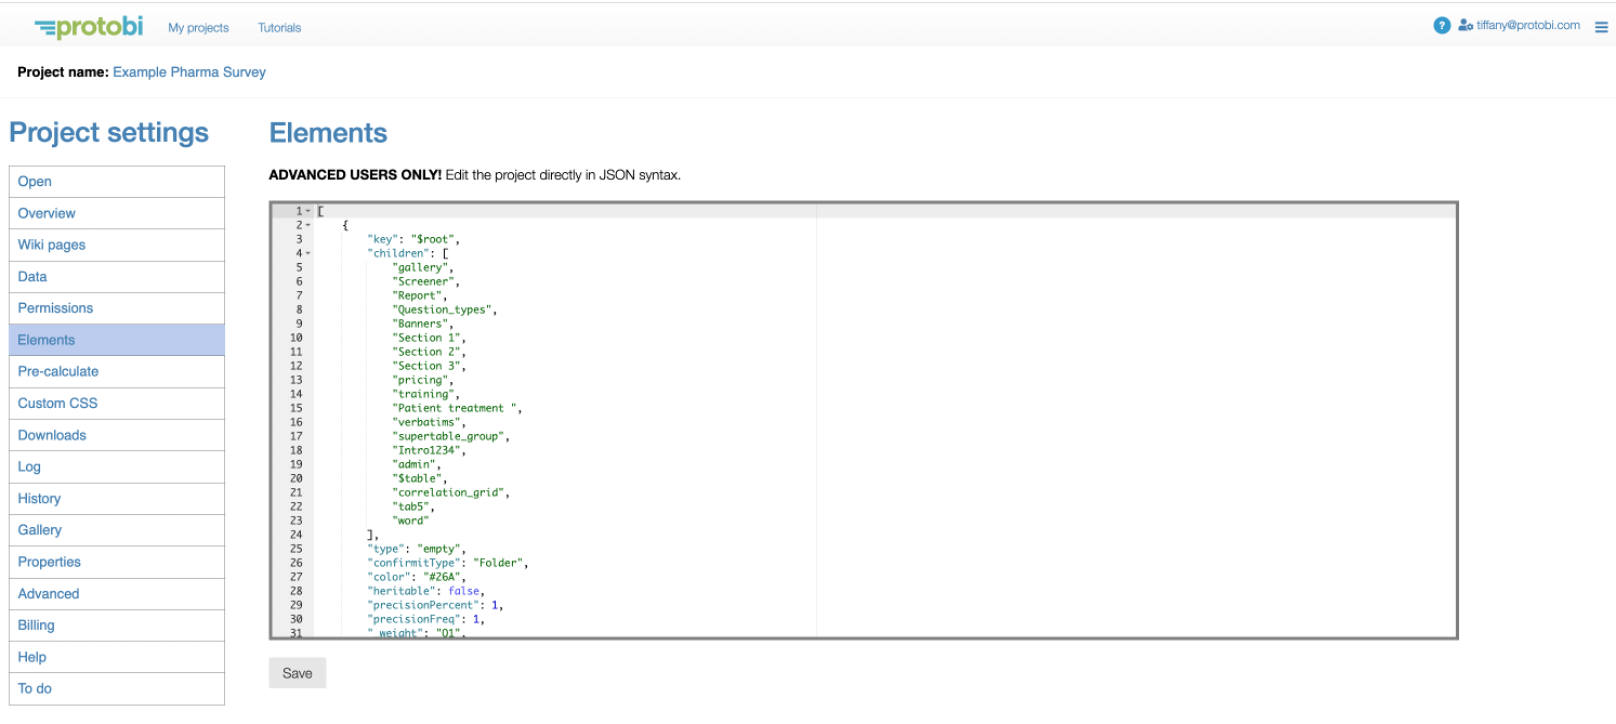
JSON editor
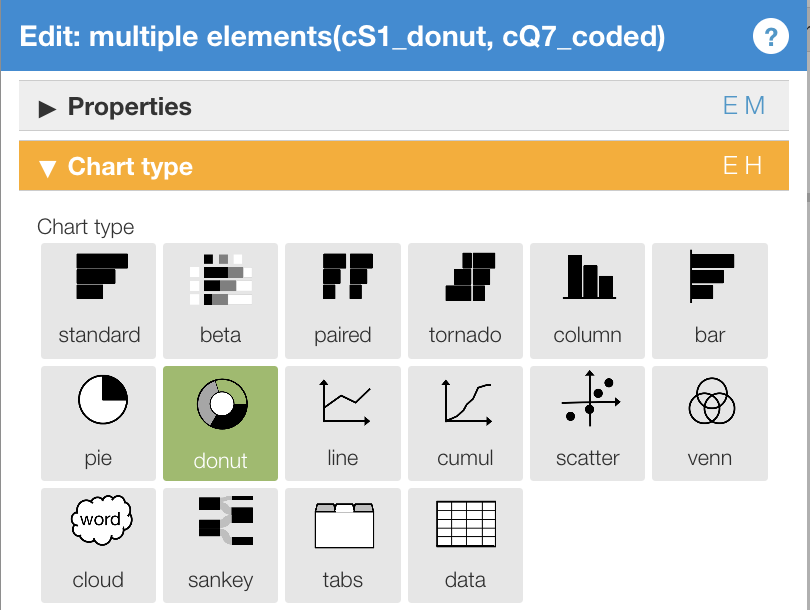
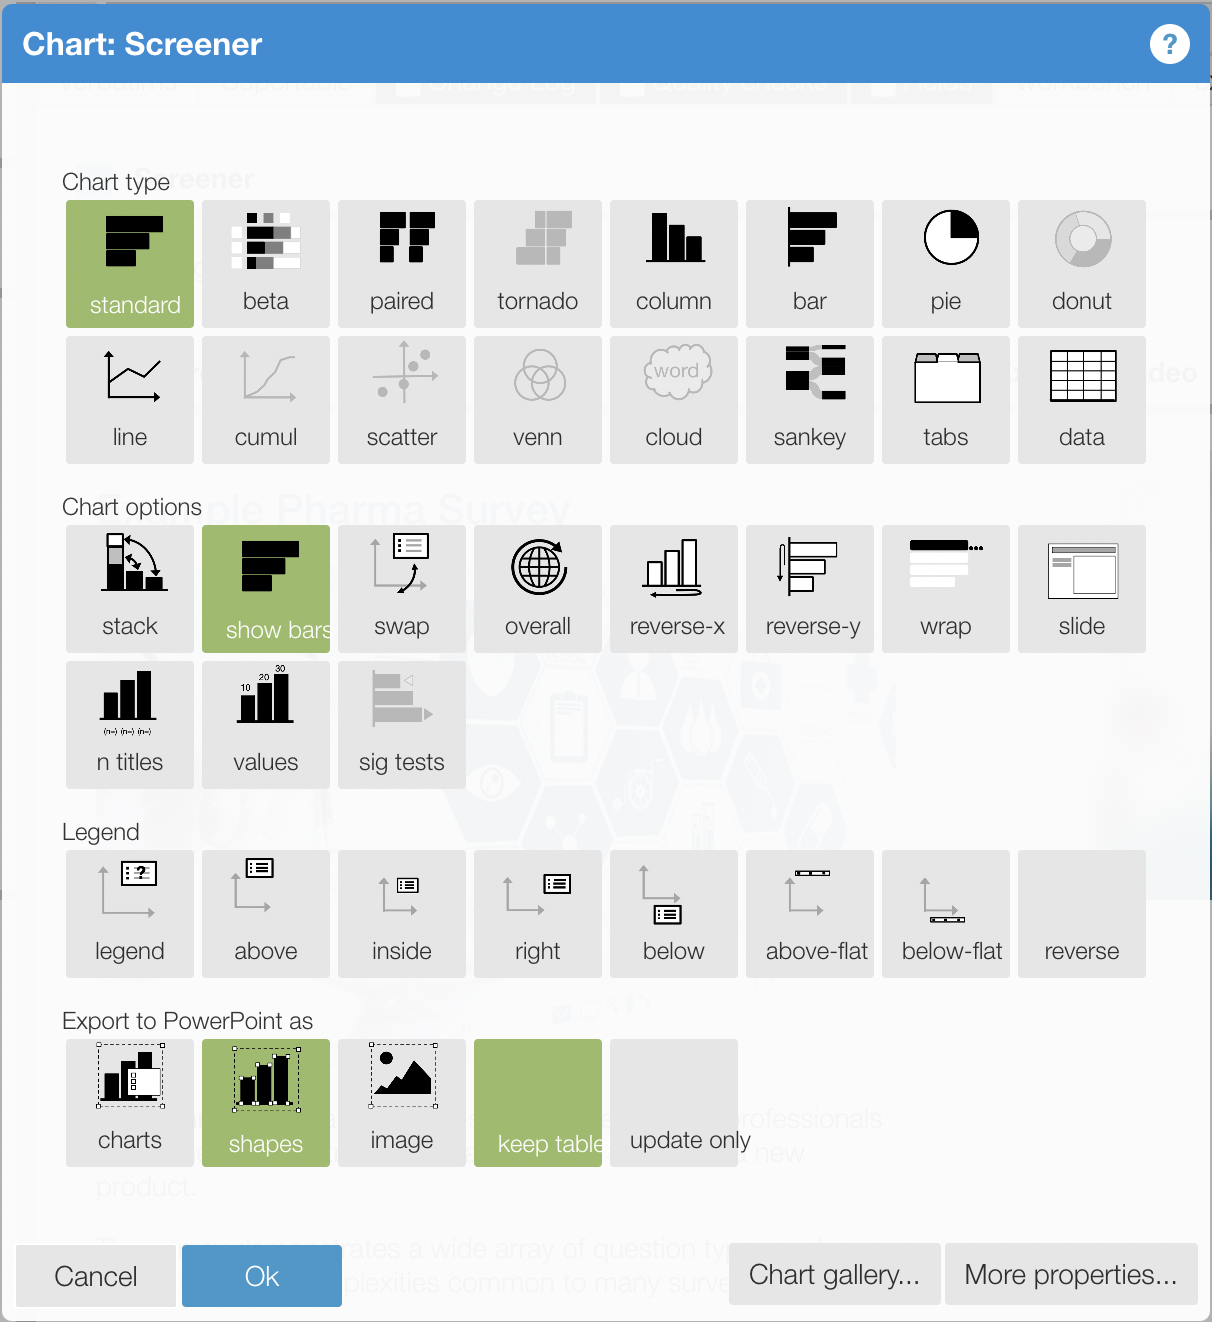
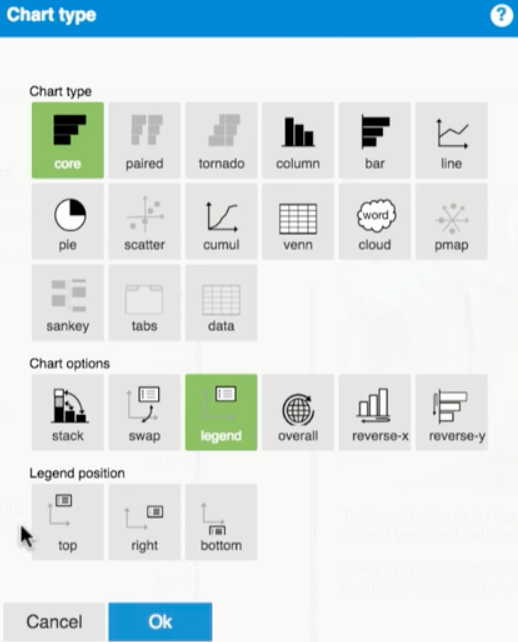
Chart types
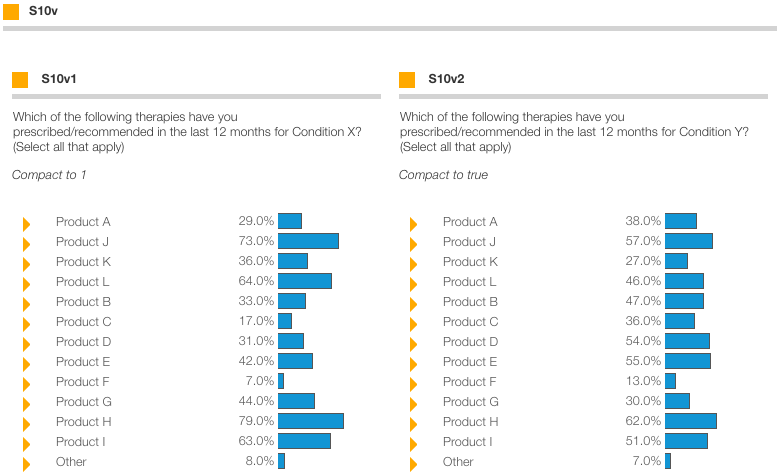
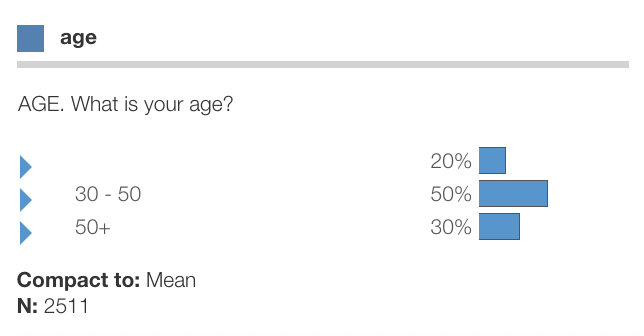
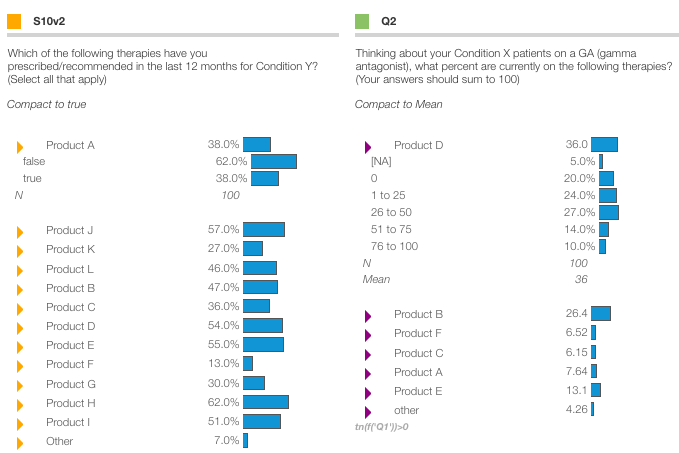
Compact to turns grid questions into a concise view
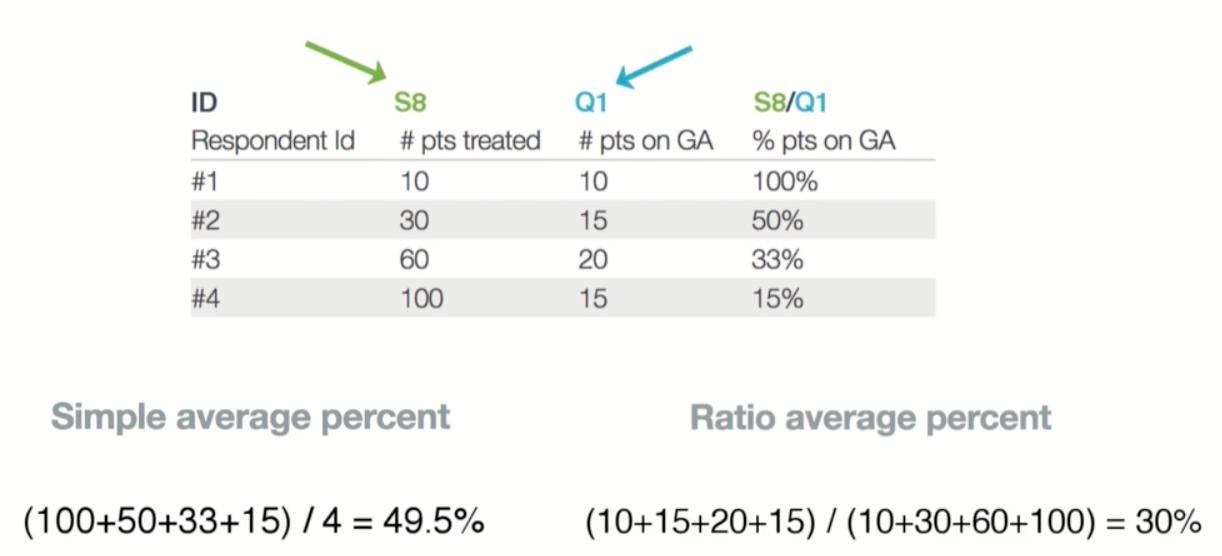
Calculating ratios
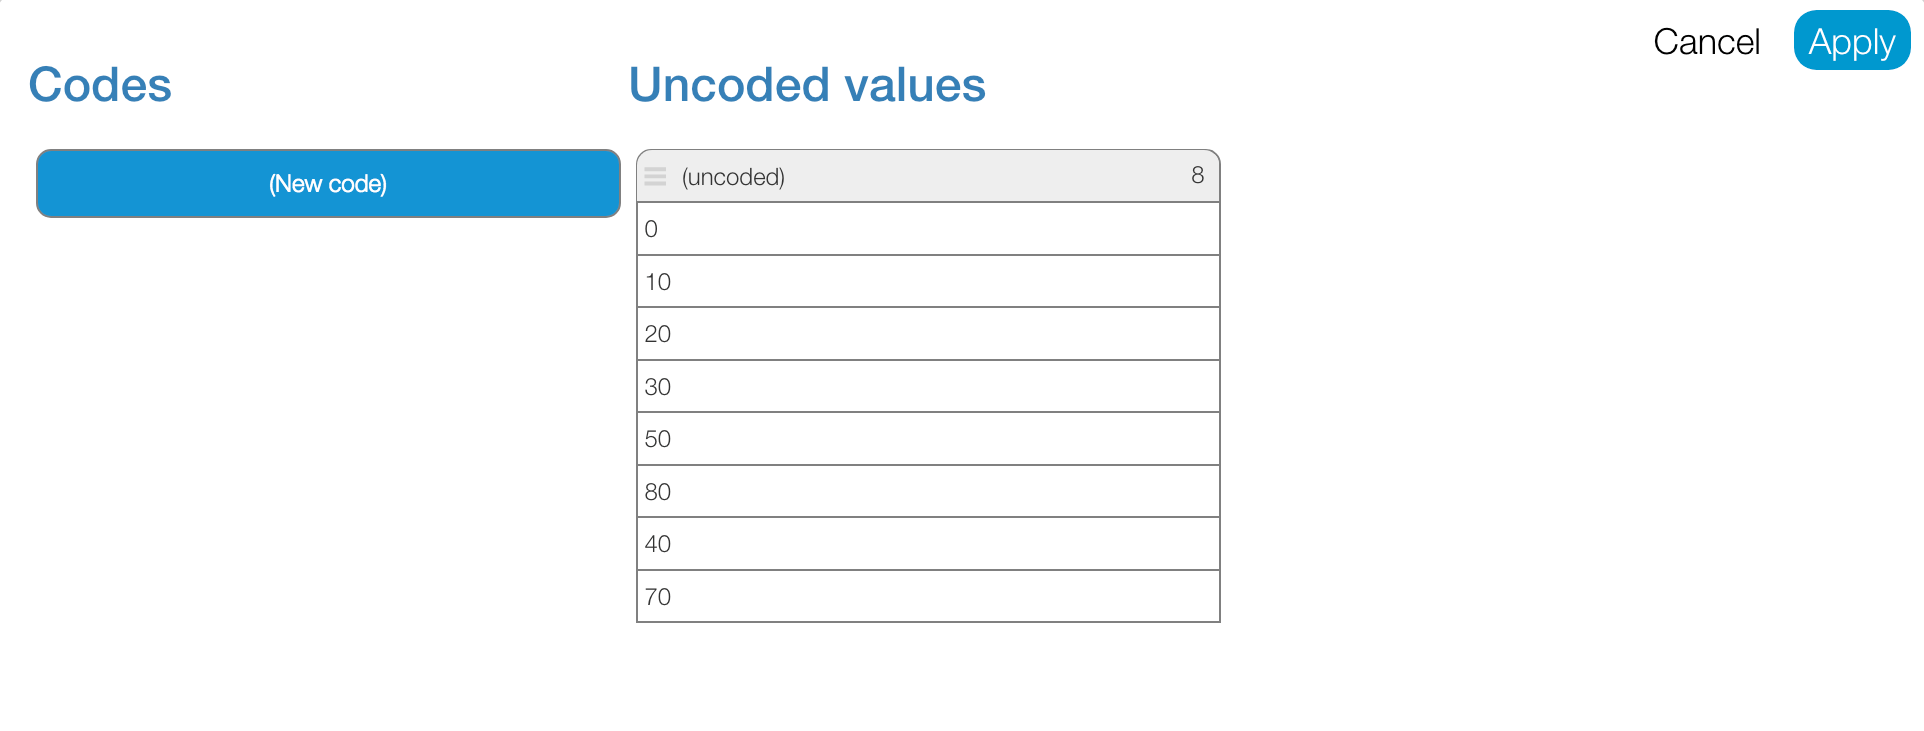
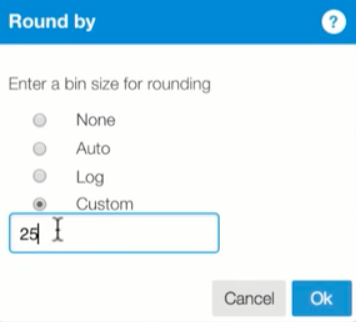
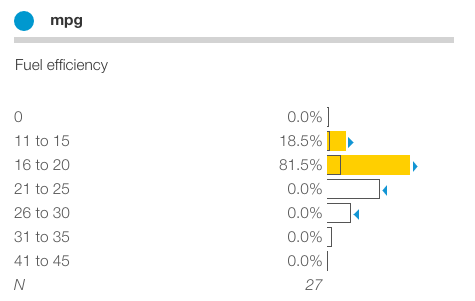
Bin values into numeric ranges
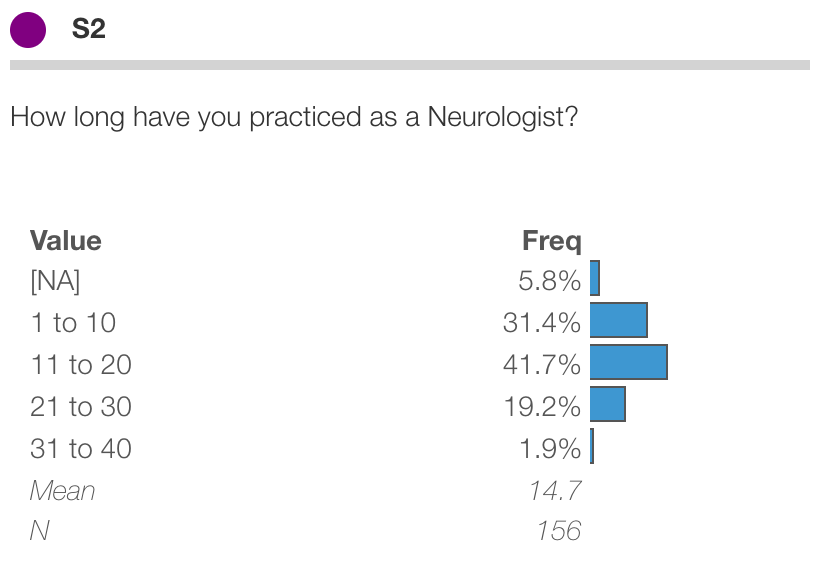
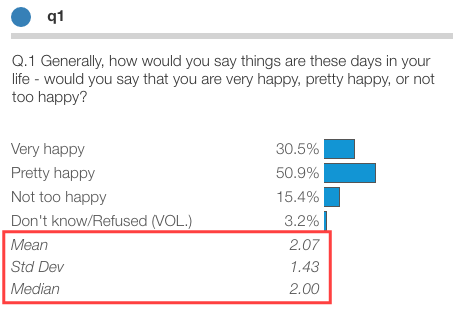
Summary statistics
Extract common text from titles
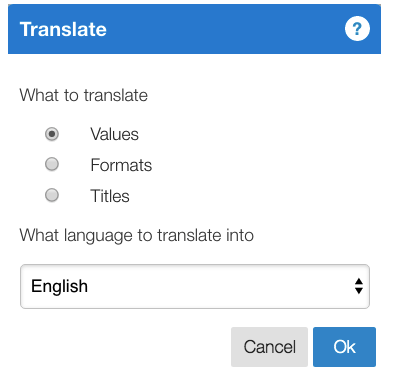
Translate languages
Ways to display rankings
Colors
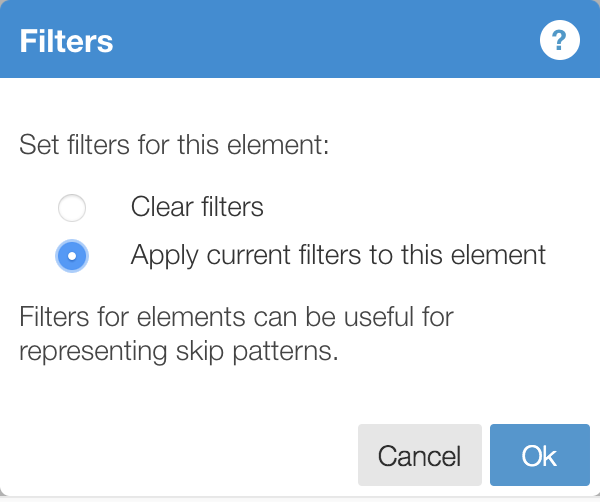
Element specific filters
Use Autogroup to quickly organize your survey
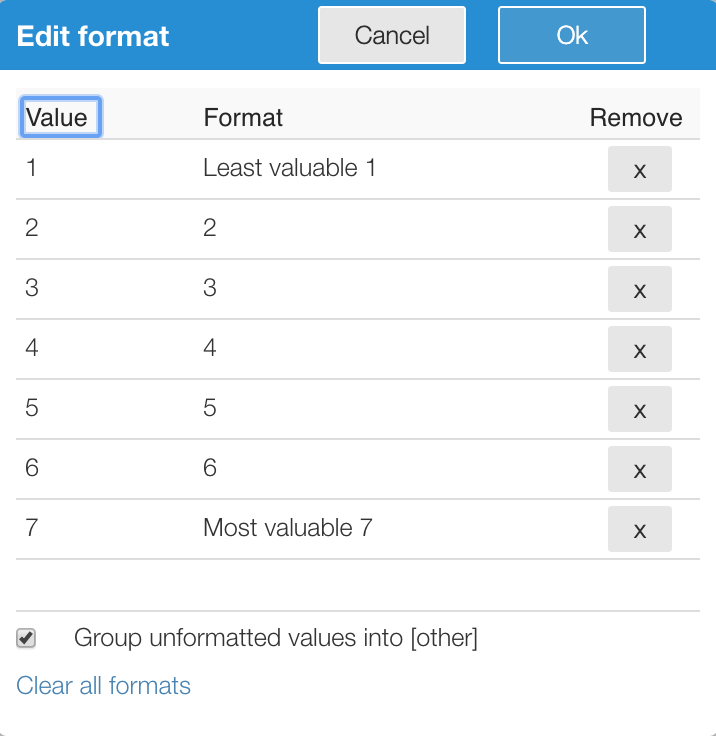
Value formats
Headline, title, display key and footnote
Hide or delete
Simple open-end recoding
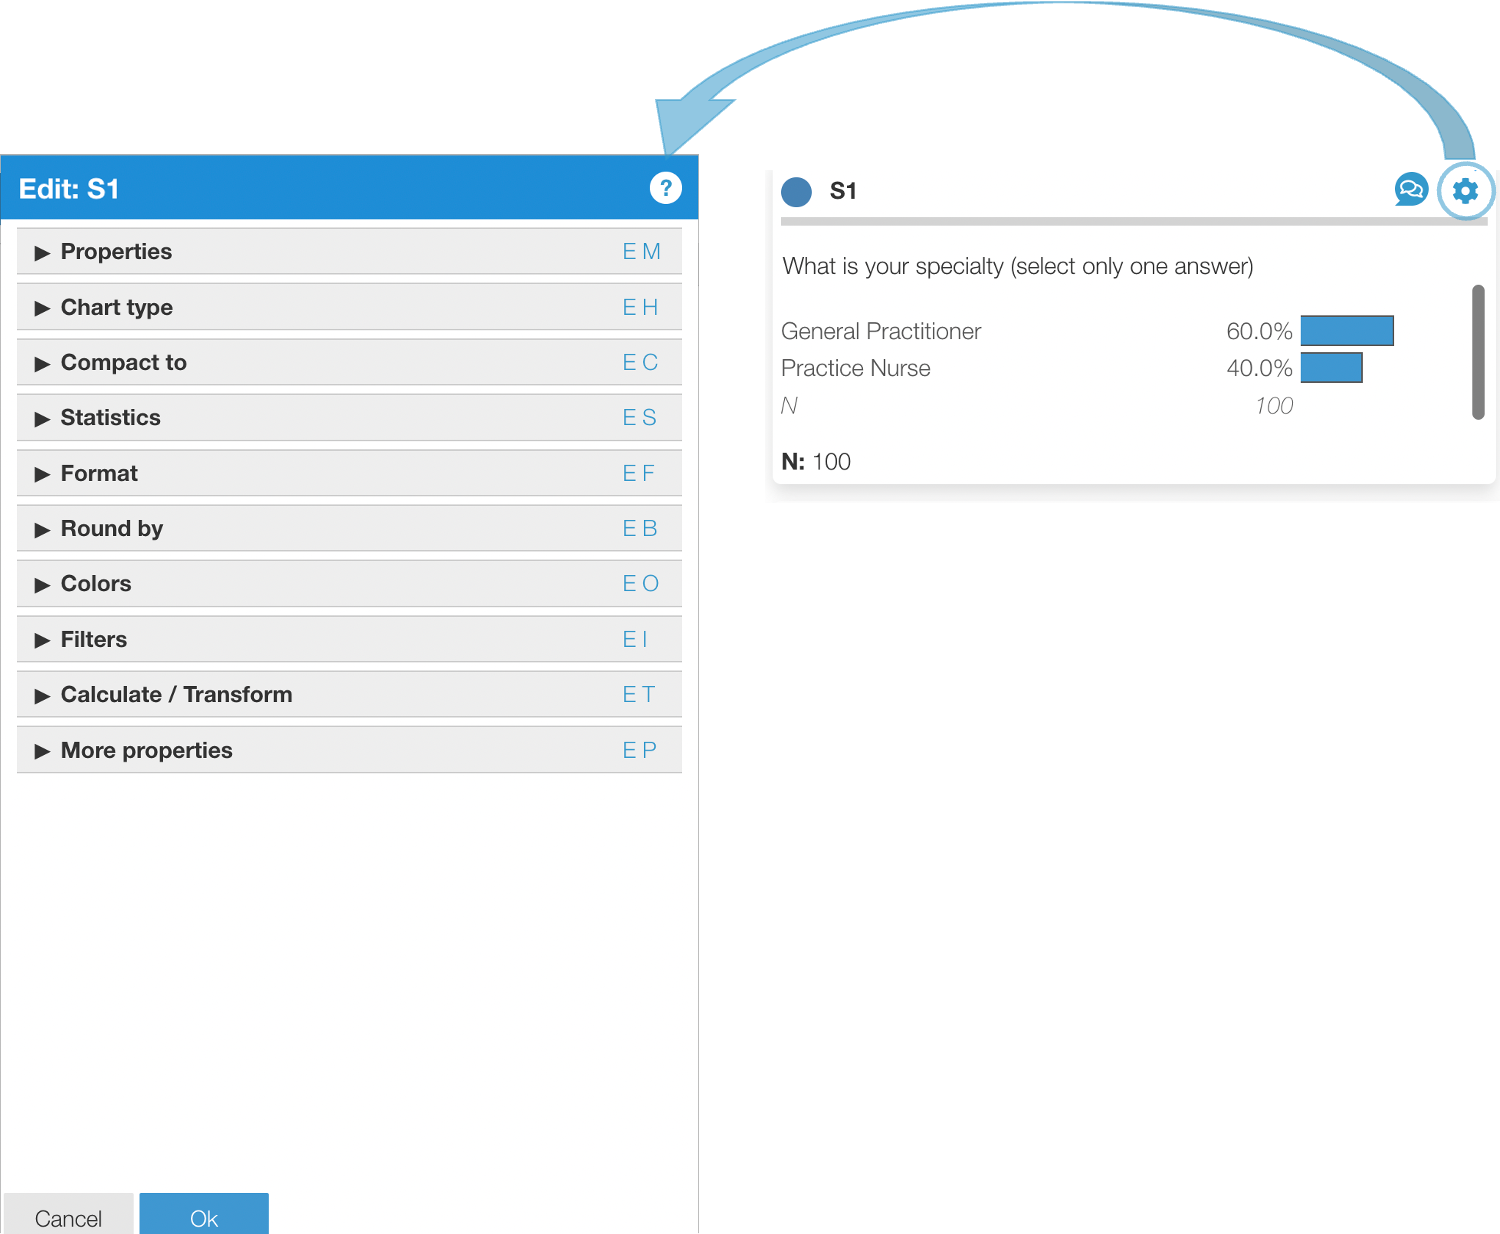
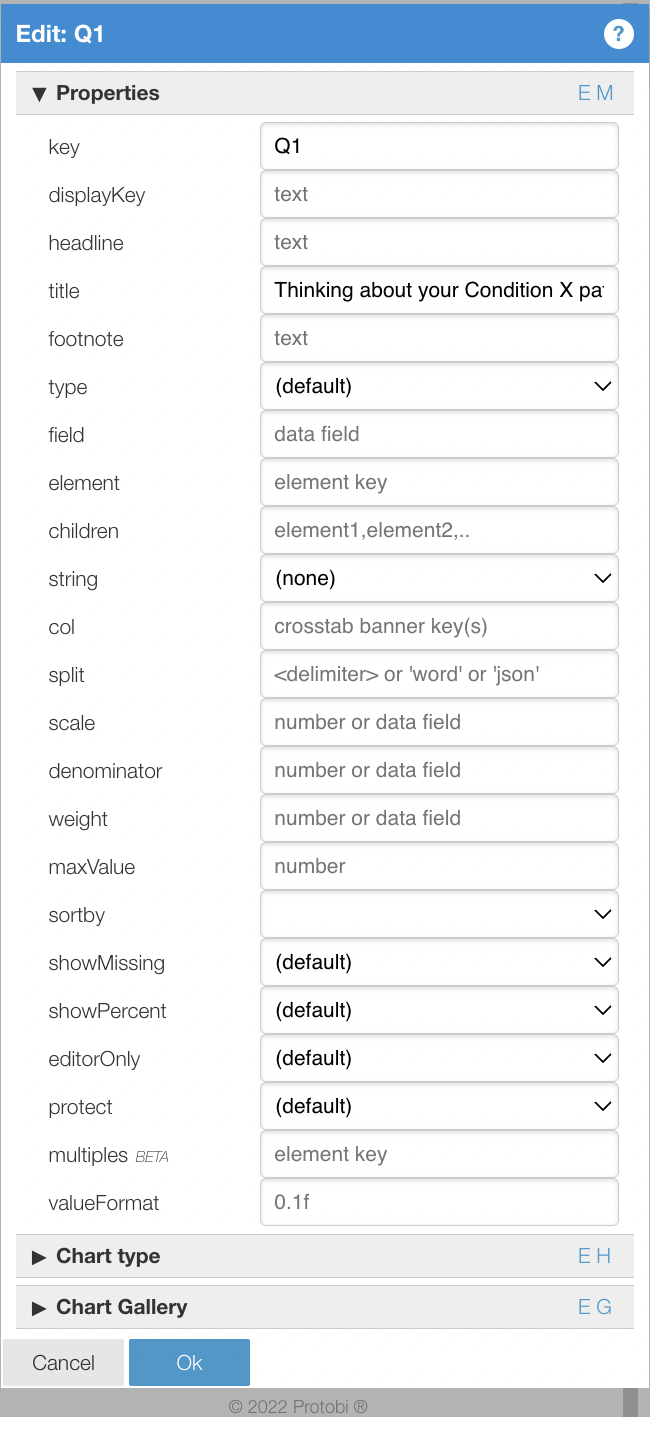
Edit properties dialog
Use alternative values to calculate summary statistics
Basic project setup
Recode dialog
Notes
Apply skip logic
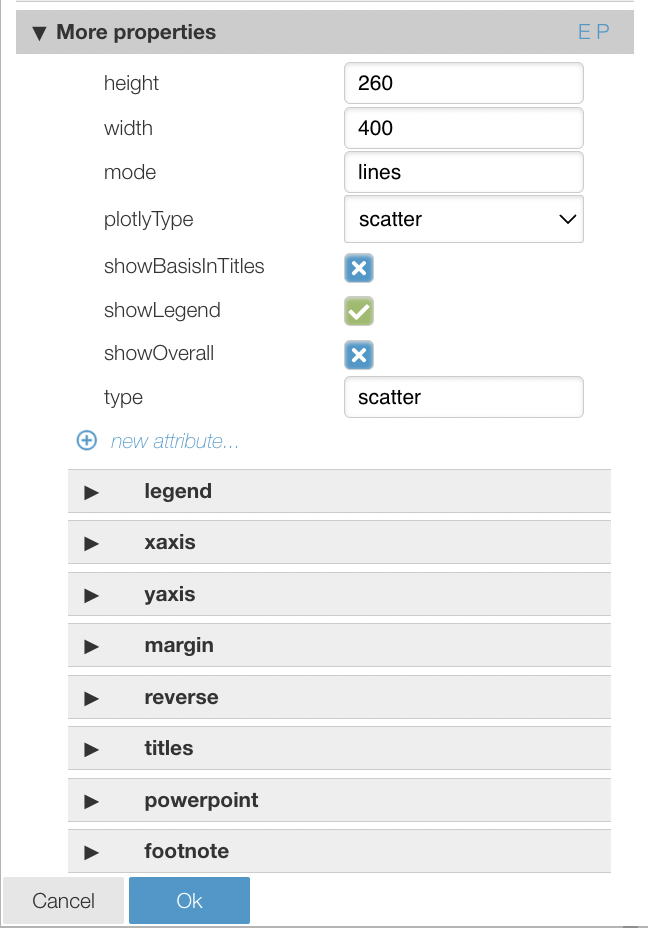
More chart properties
Tips to design neat and engaging projects
Editor Panel
How elements get their data: field, element and transform
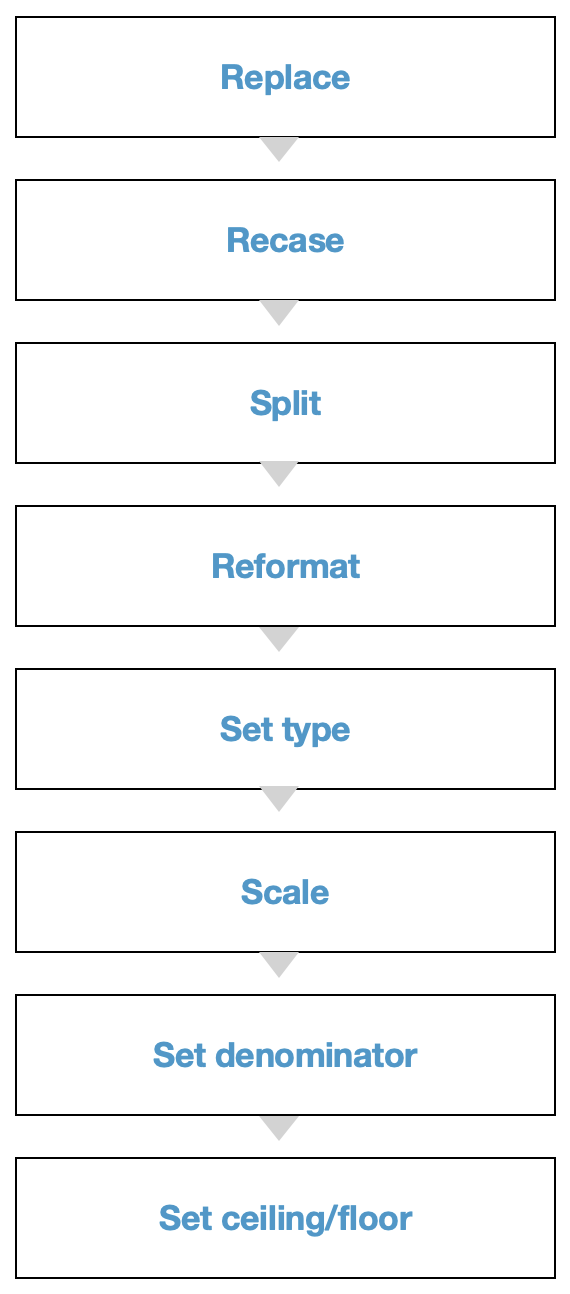
Protobi's order of operations
Copy/paste elements to create different views or apply attributes from one element to another
Edit multiple elements at once
See and edit data for charts in table view
Intermediate topics for editors
Date/time values
Extreme values: Winsorize, trim or retain?
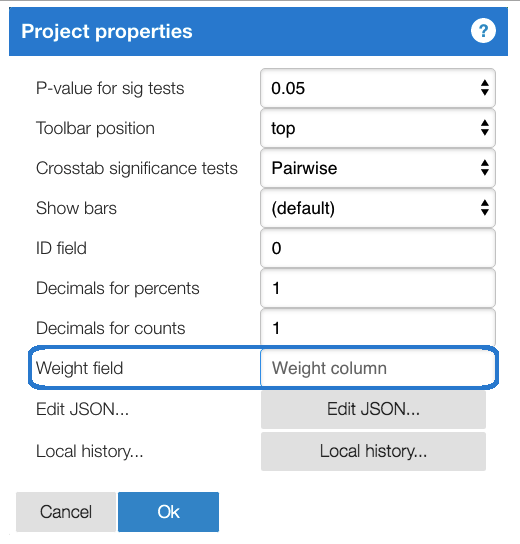
Weights
JSON syntax
Splitting text responses
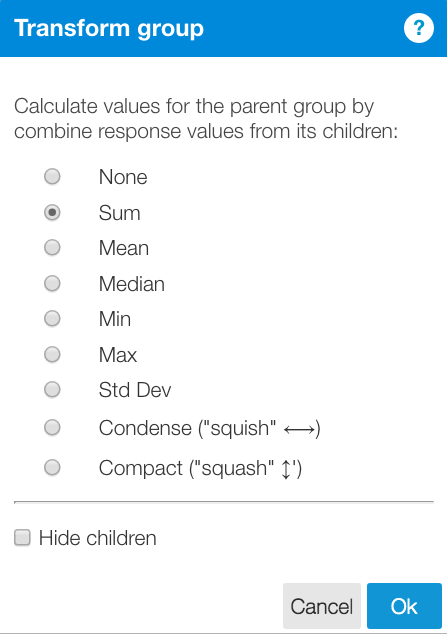
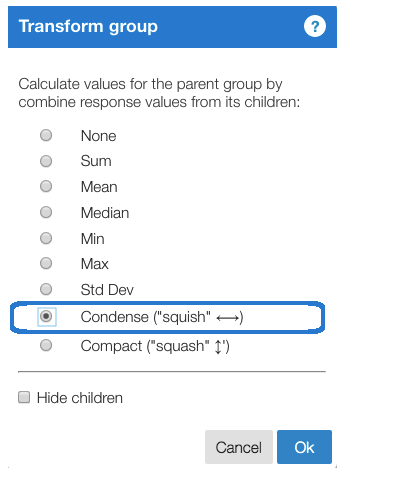
Aggregating and summarizing group data using Transform
Numeric variables with long-tail distributions
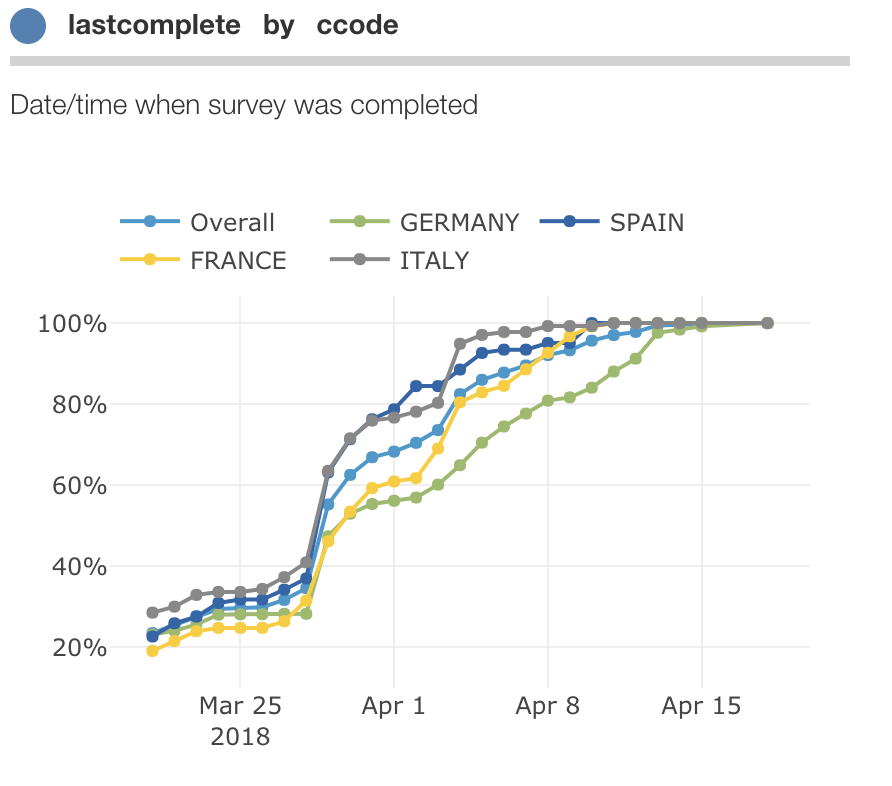
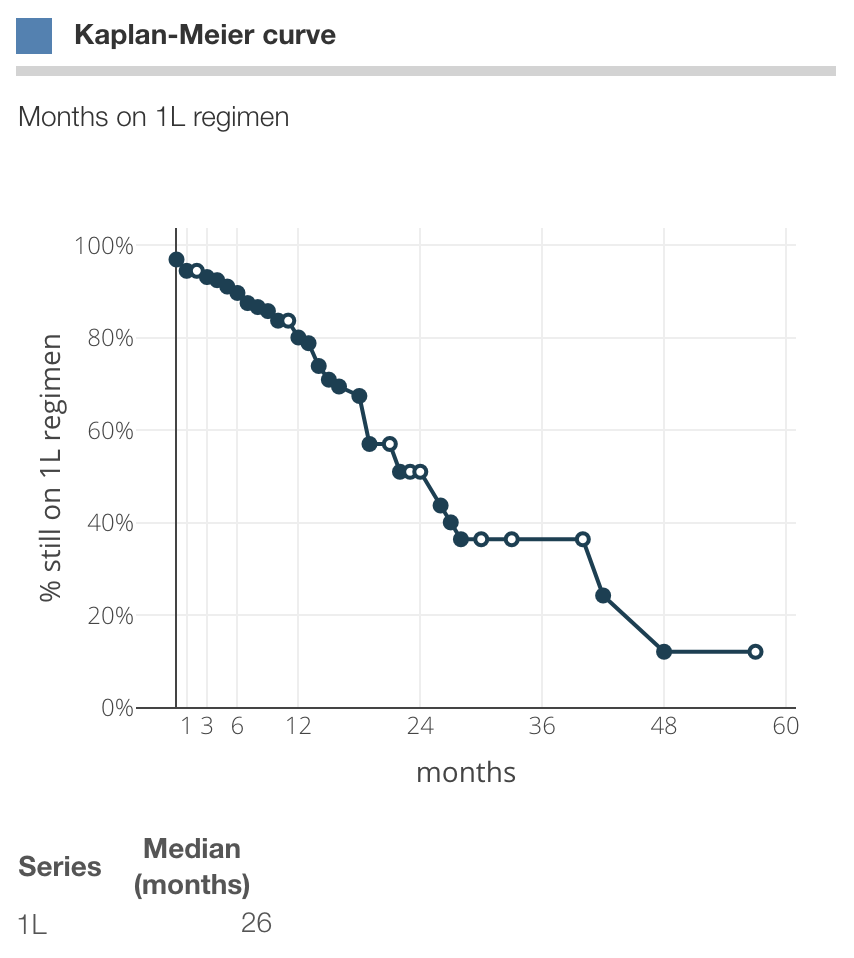
Kaplan-Meier curves
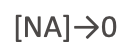
Replace missing values with zeros
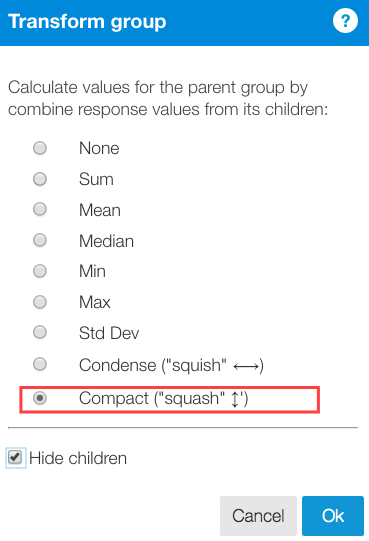
Transform a group into its compact values
Date/time calculations
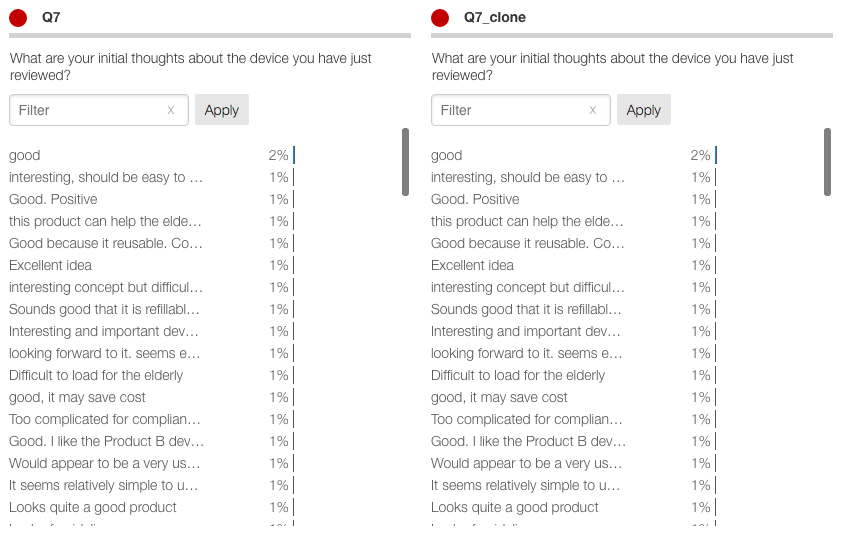
Duplicate or "clone" a workspace
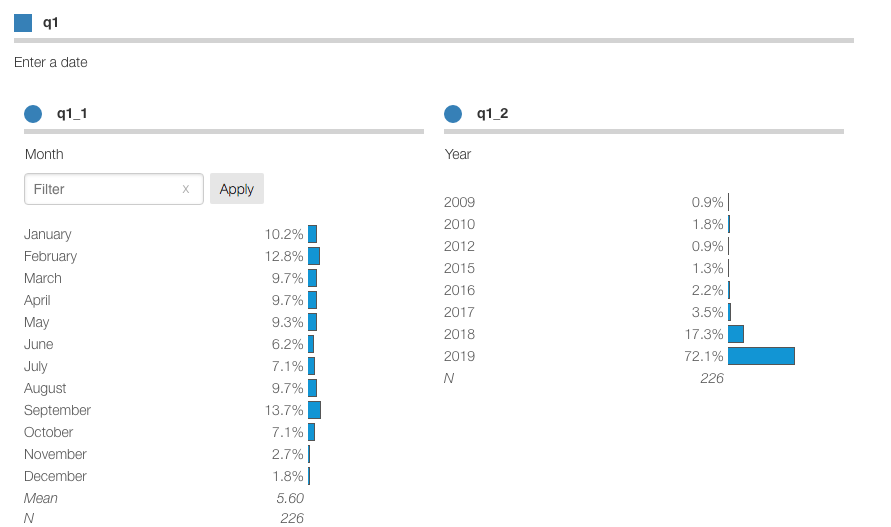
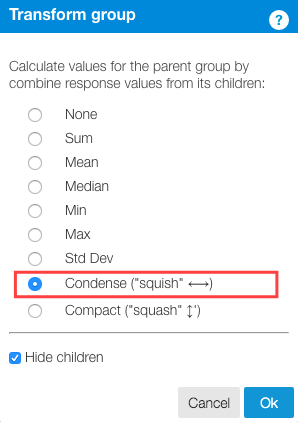
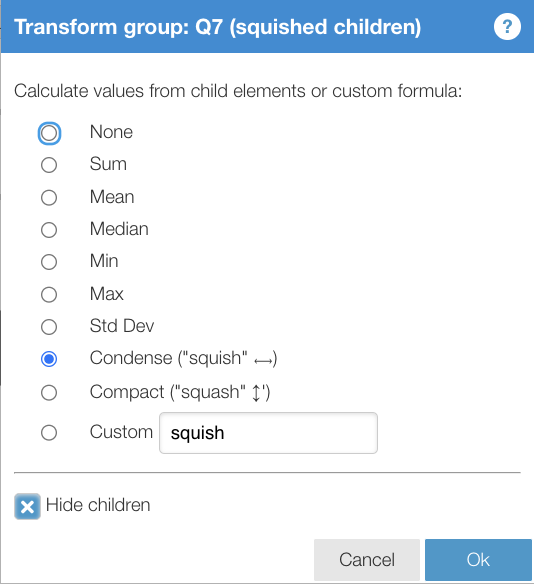
Transform to condense
Comparing dates
Count checkbox selections
Use slide layout to build your report
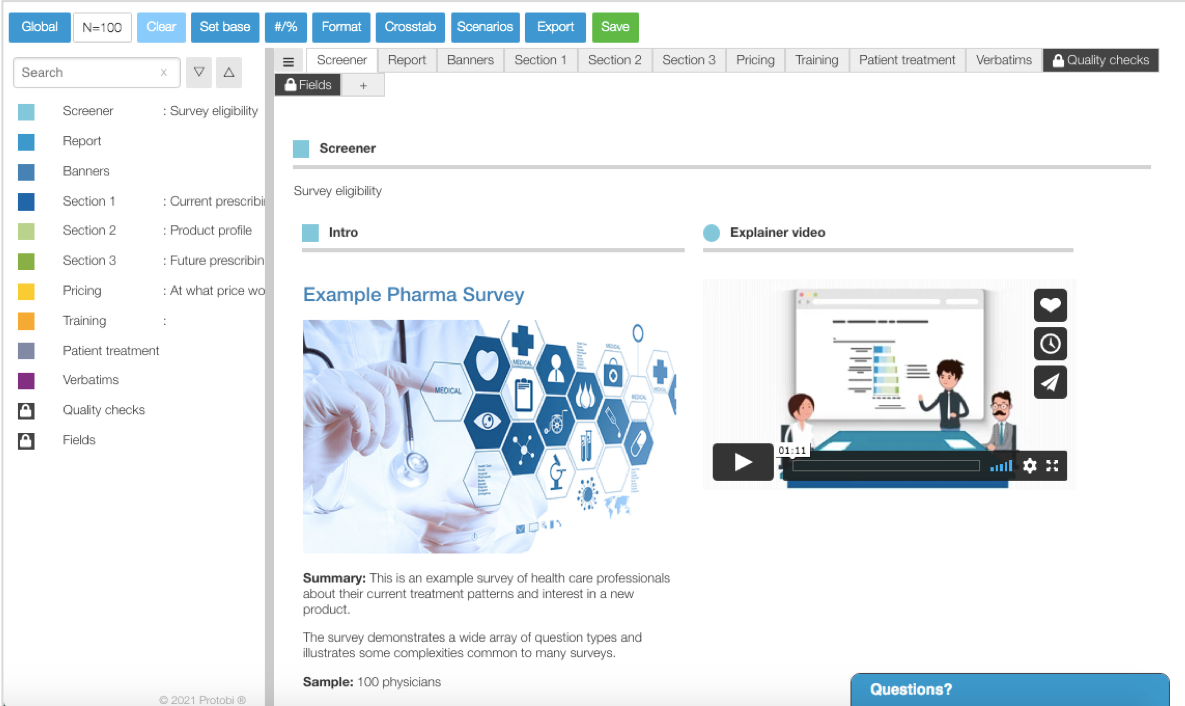
Show text, images and videos in your project
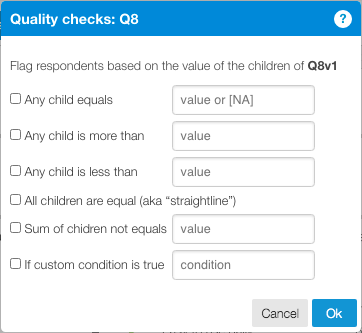
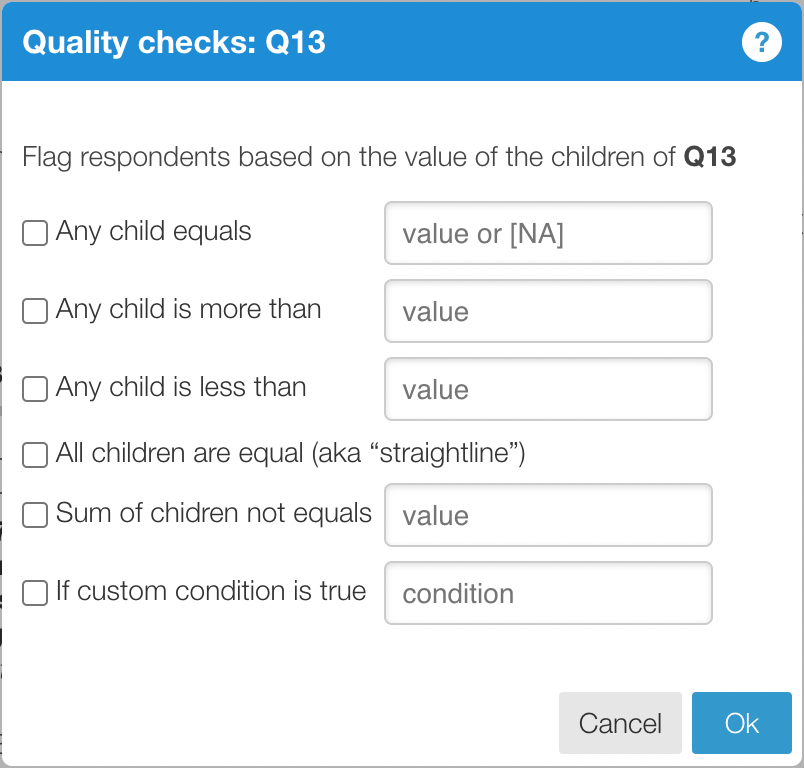
Quality check responses and flag outliers
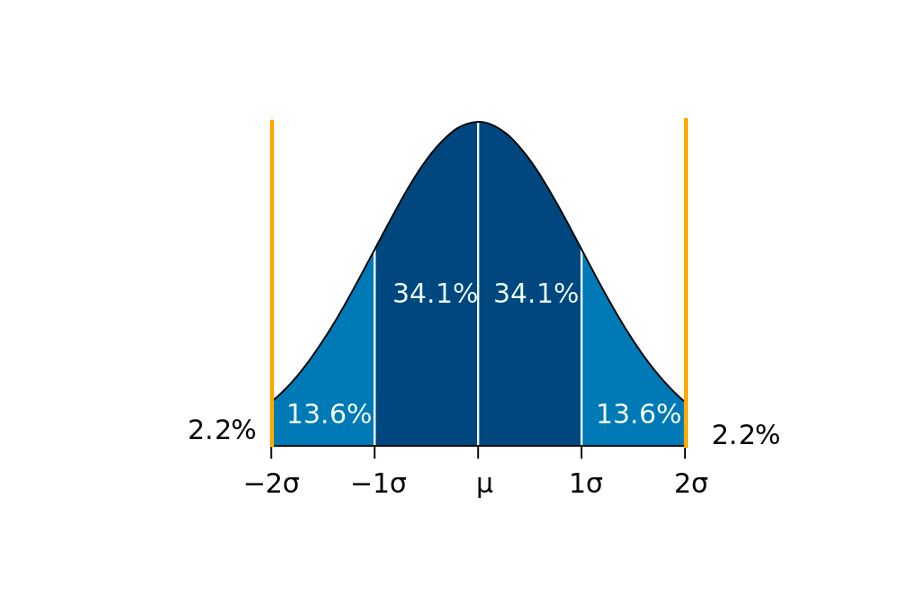
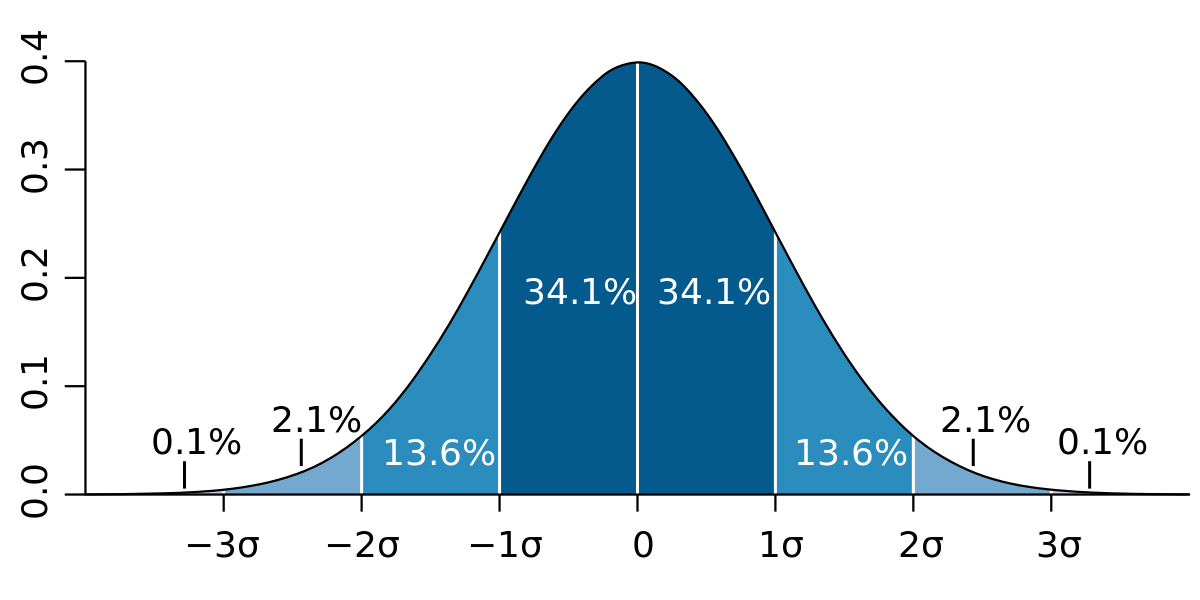
Check for straight-liners with standard deviation
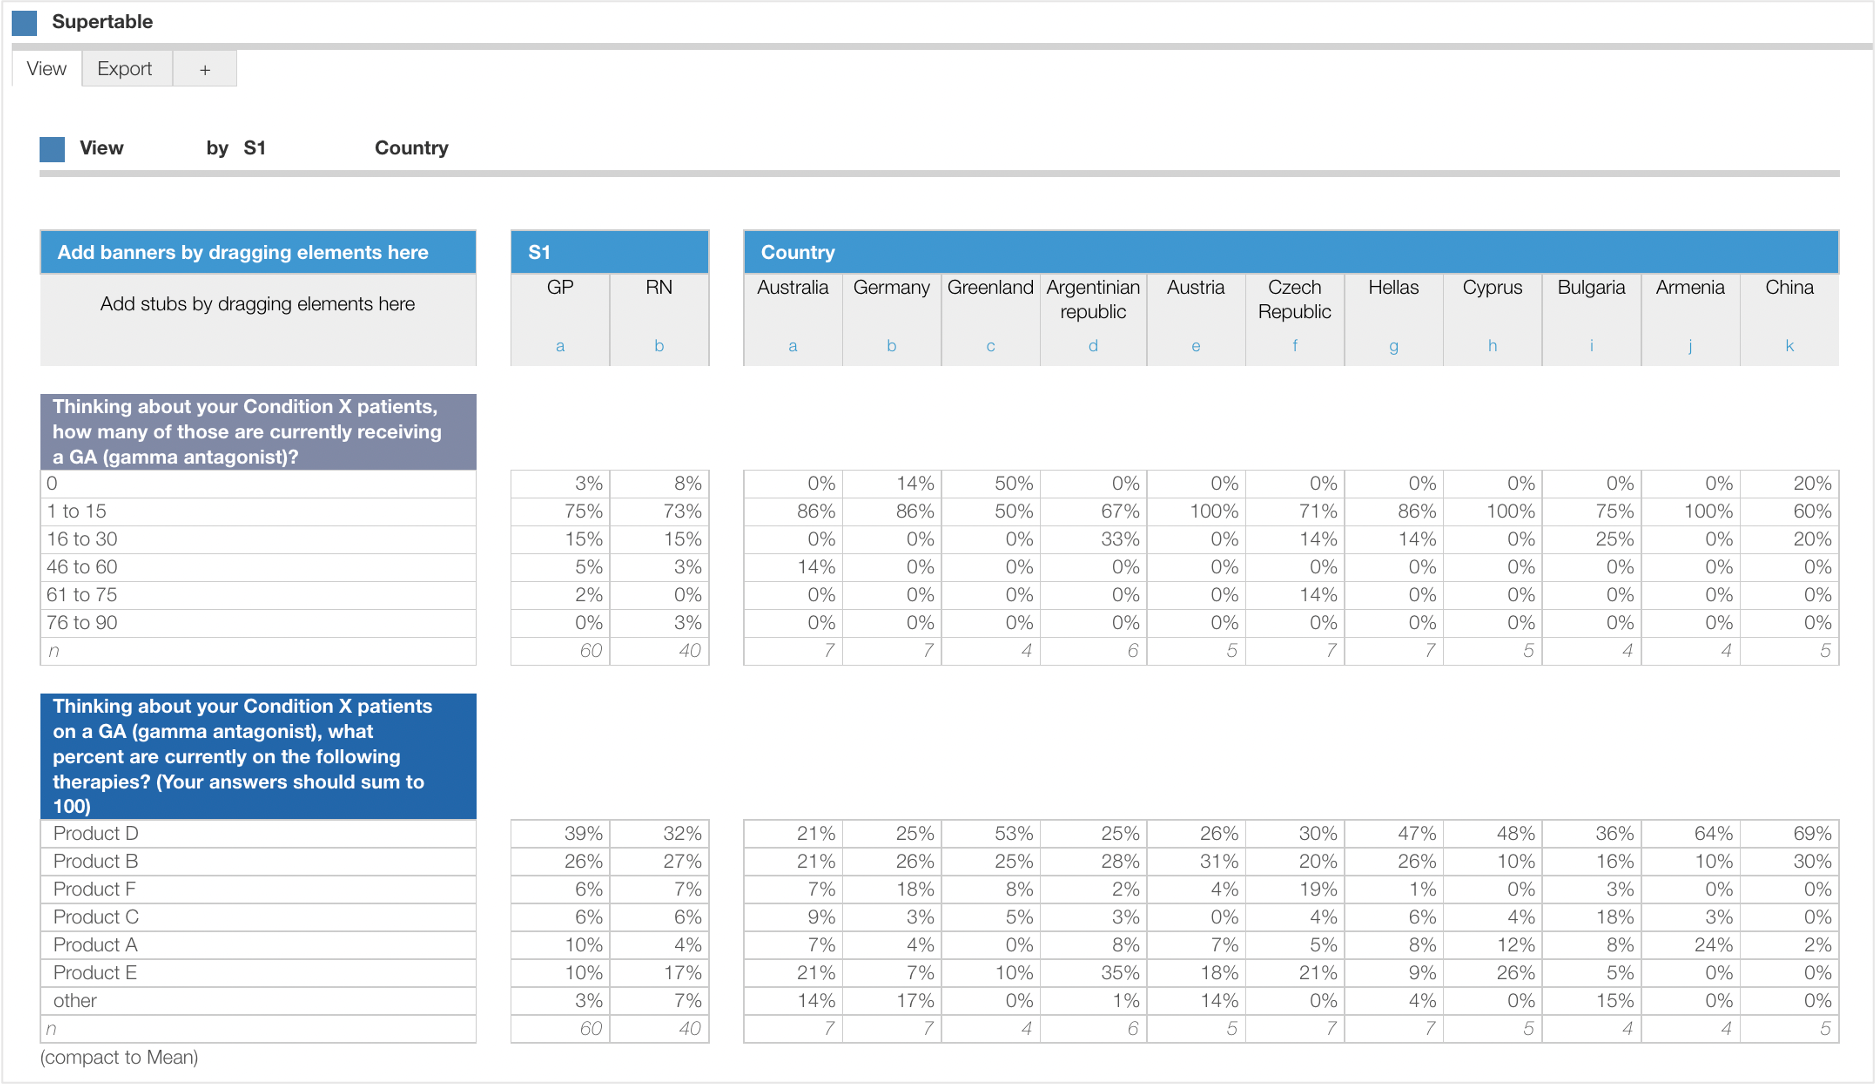
Generate large crosstabs to Excel using Protobi’s SuperTables
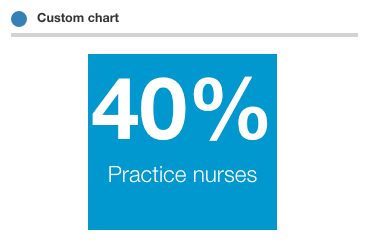
Create custom charts
Create a new workspace for a tracking study
Create and automate reports in Protobi
Create charts from Excel data
Charts
PairedTable
Chart types
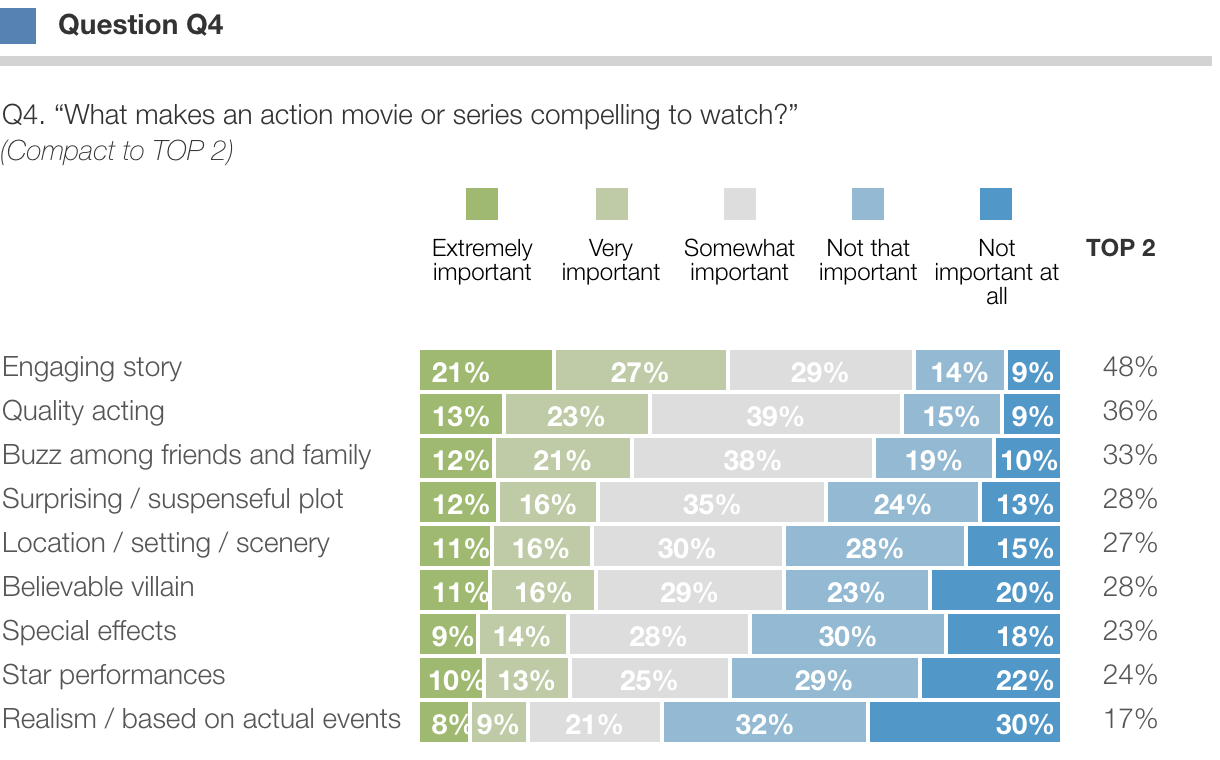
TopBoxTornado for multiple ratings
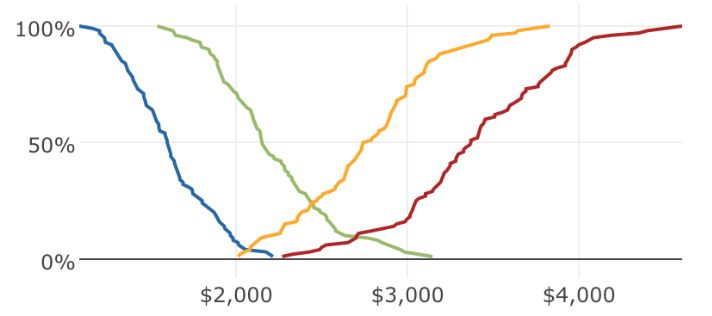
Van Westendorp's Price Sensitivity Meter
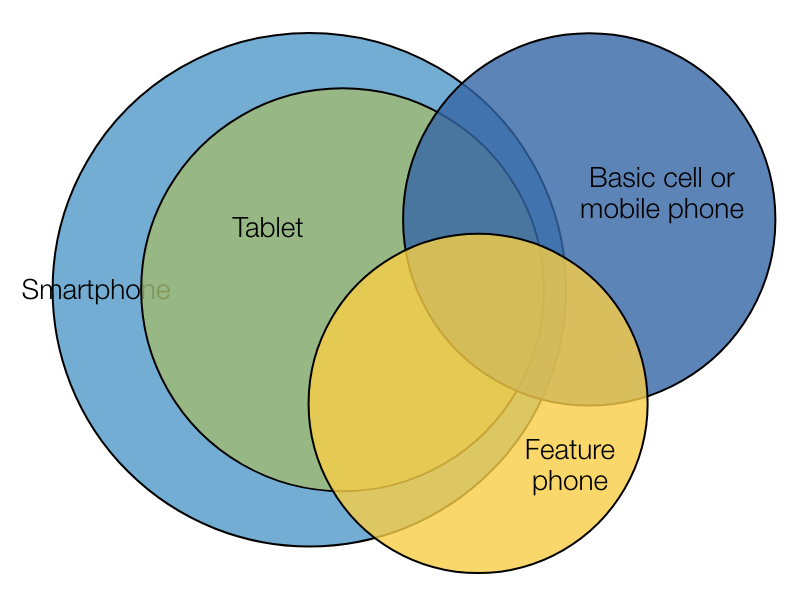
Venn diagrams
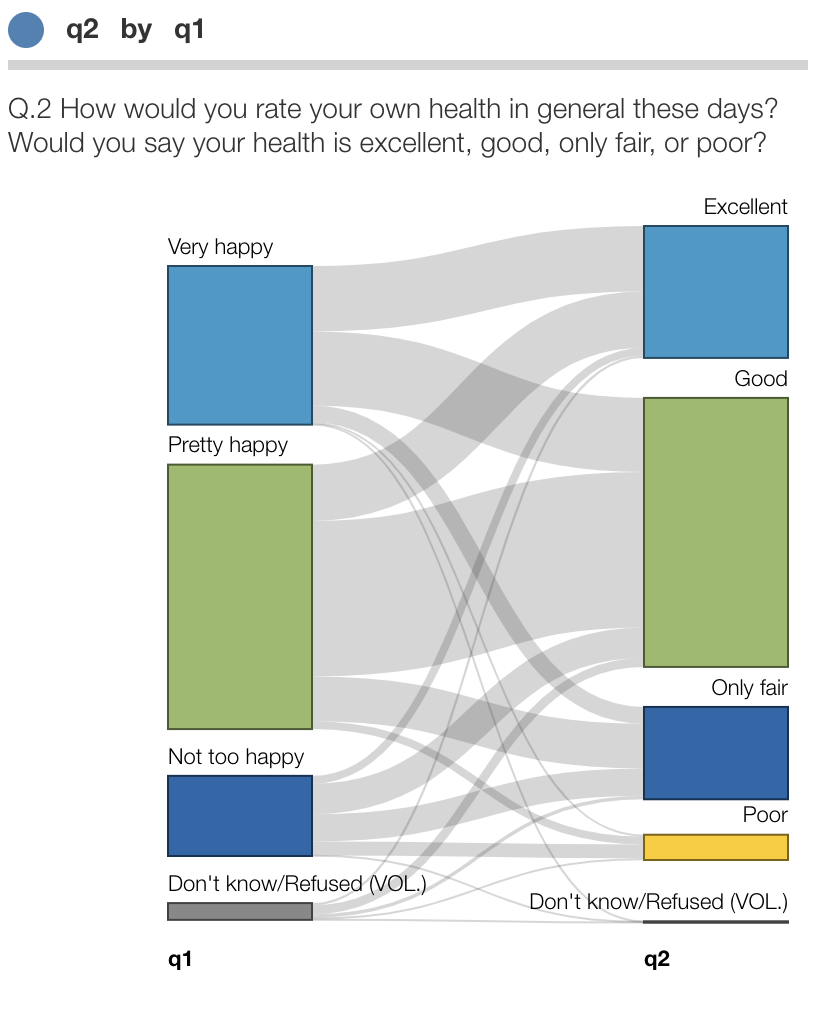
Sankey flow diagrams
Google Maps chart
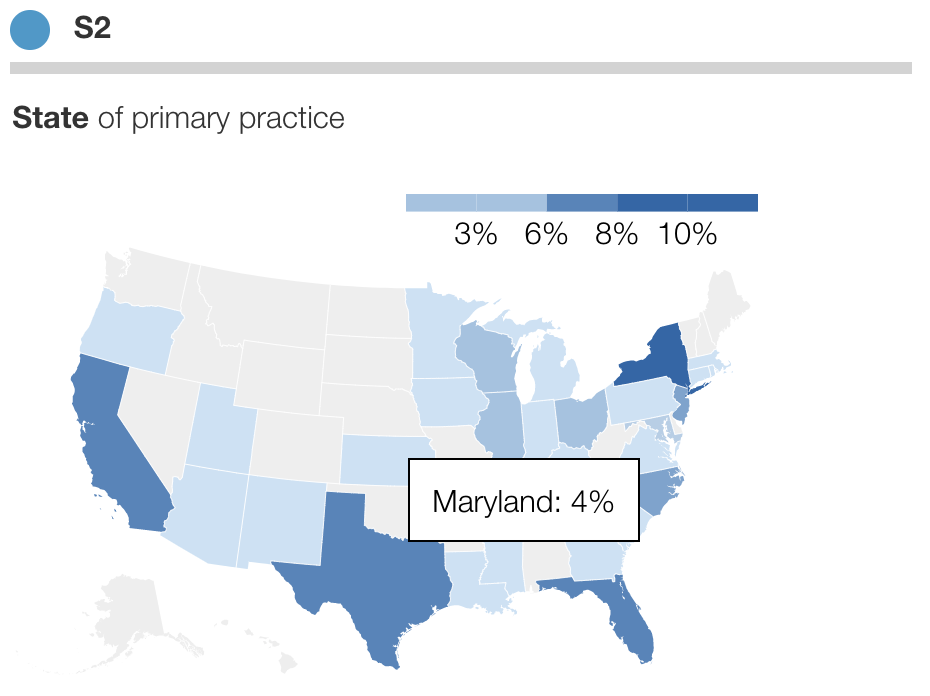
US State maps
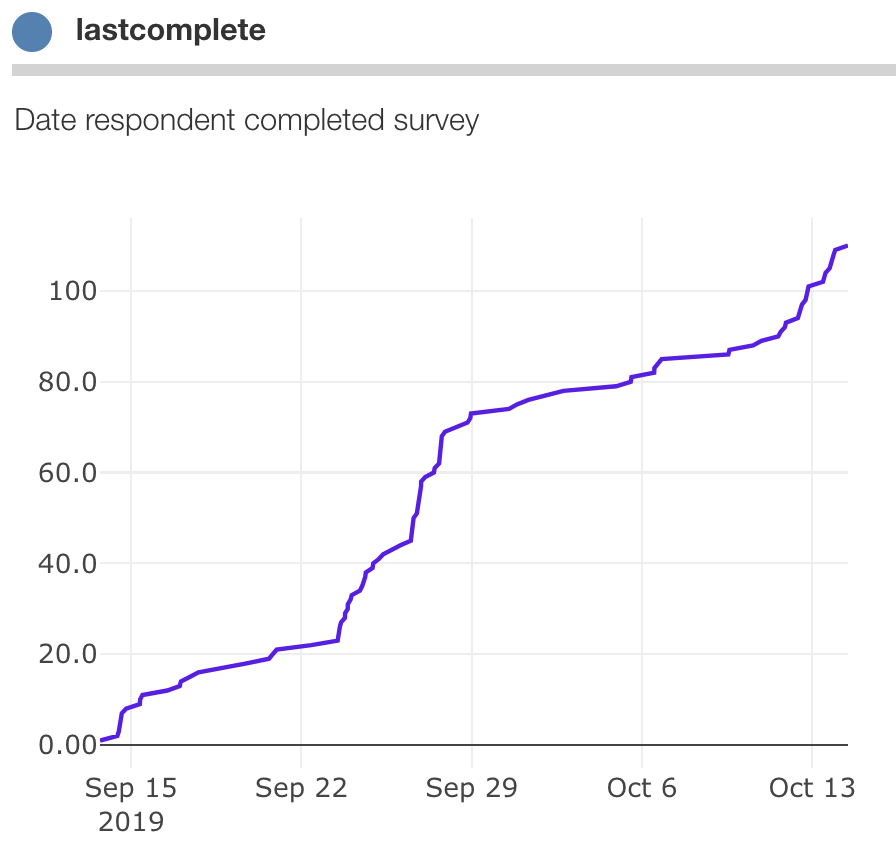
Cumulative line charts
Print layout charts (beta)
Text open-end questions
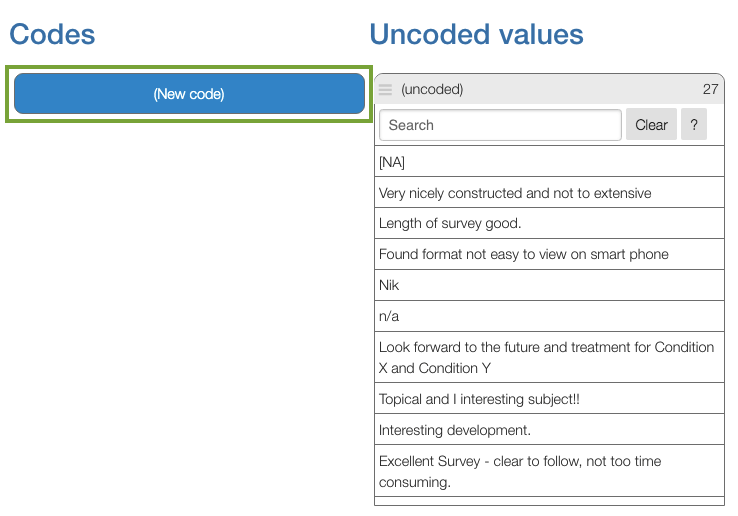
Condense text open-ends
Splitting text responses
Search open-ends using regular expression
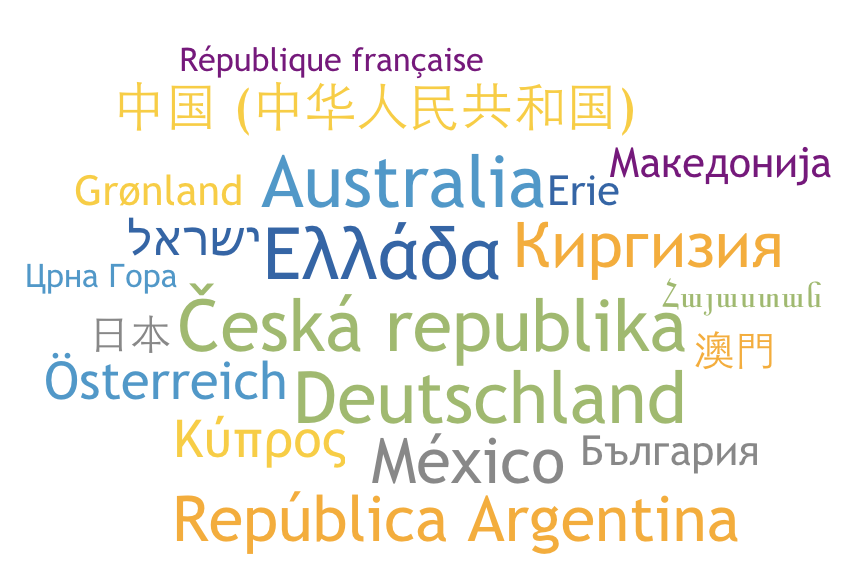
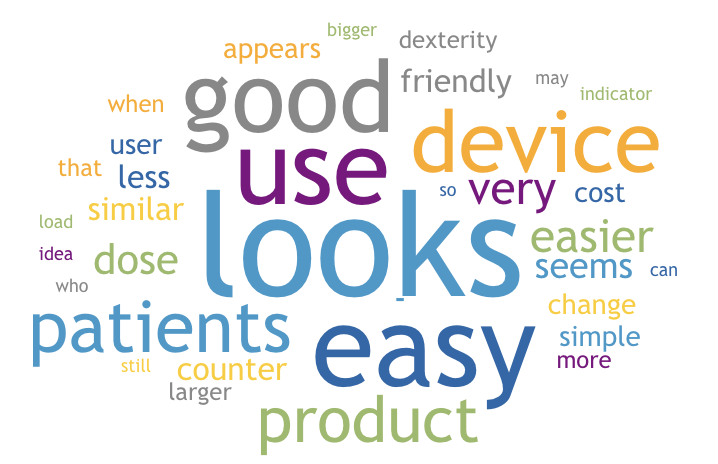
Word clouds
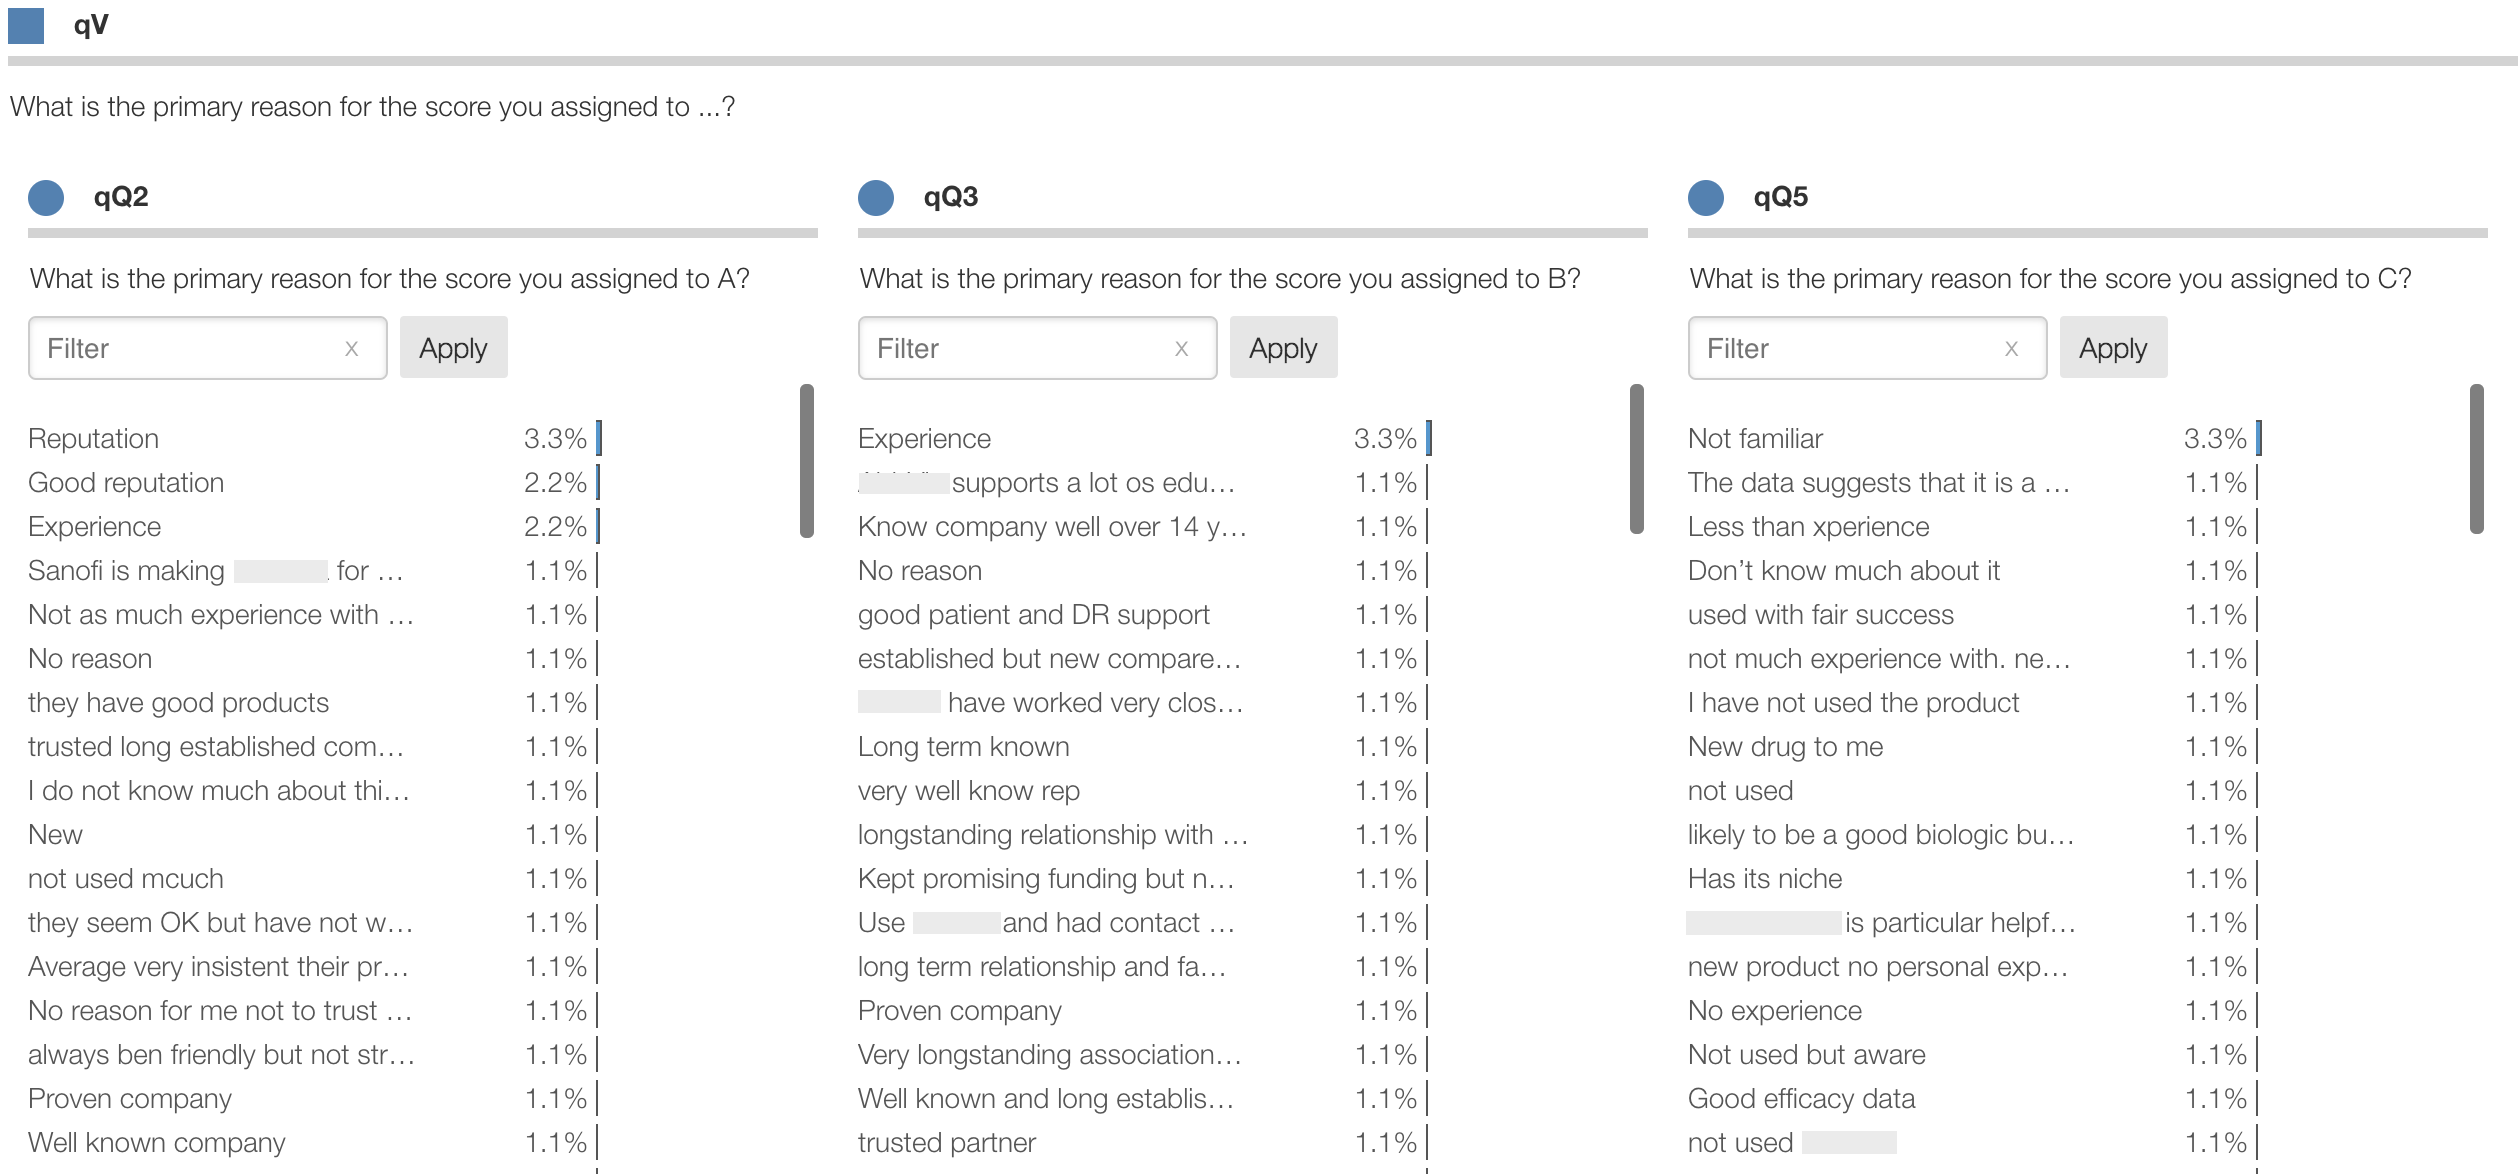
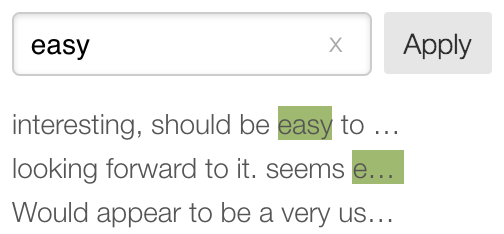
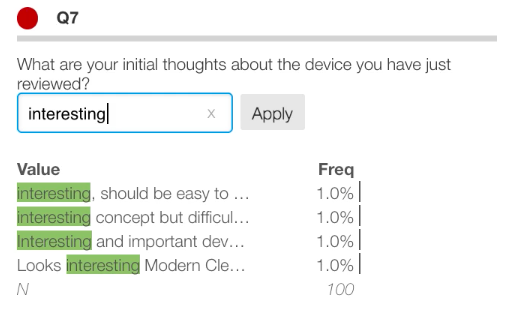
Search and filter text open-ends
Let's make a word cloud
Recode text for analysis
Condense text open-ends video
Simple open-end recoding
Separate words in text open-ends
Search and filter text responses
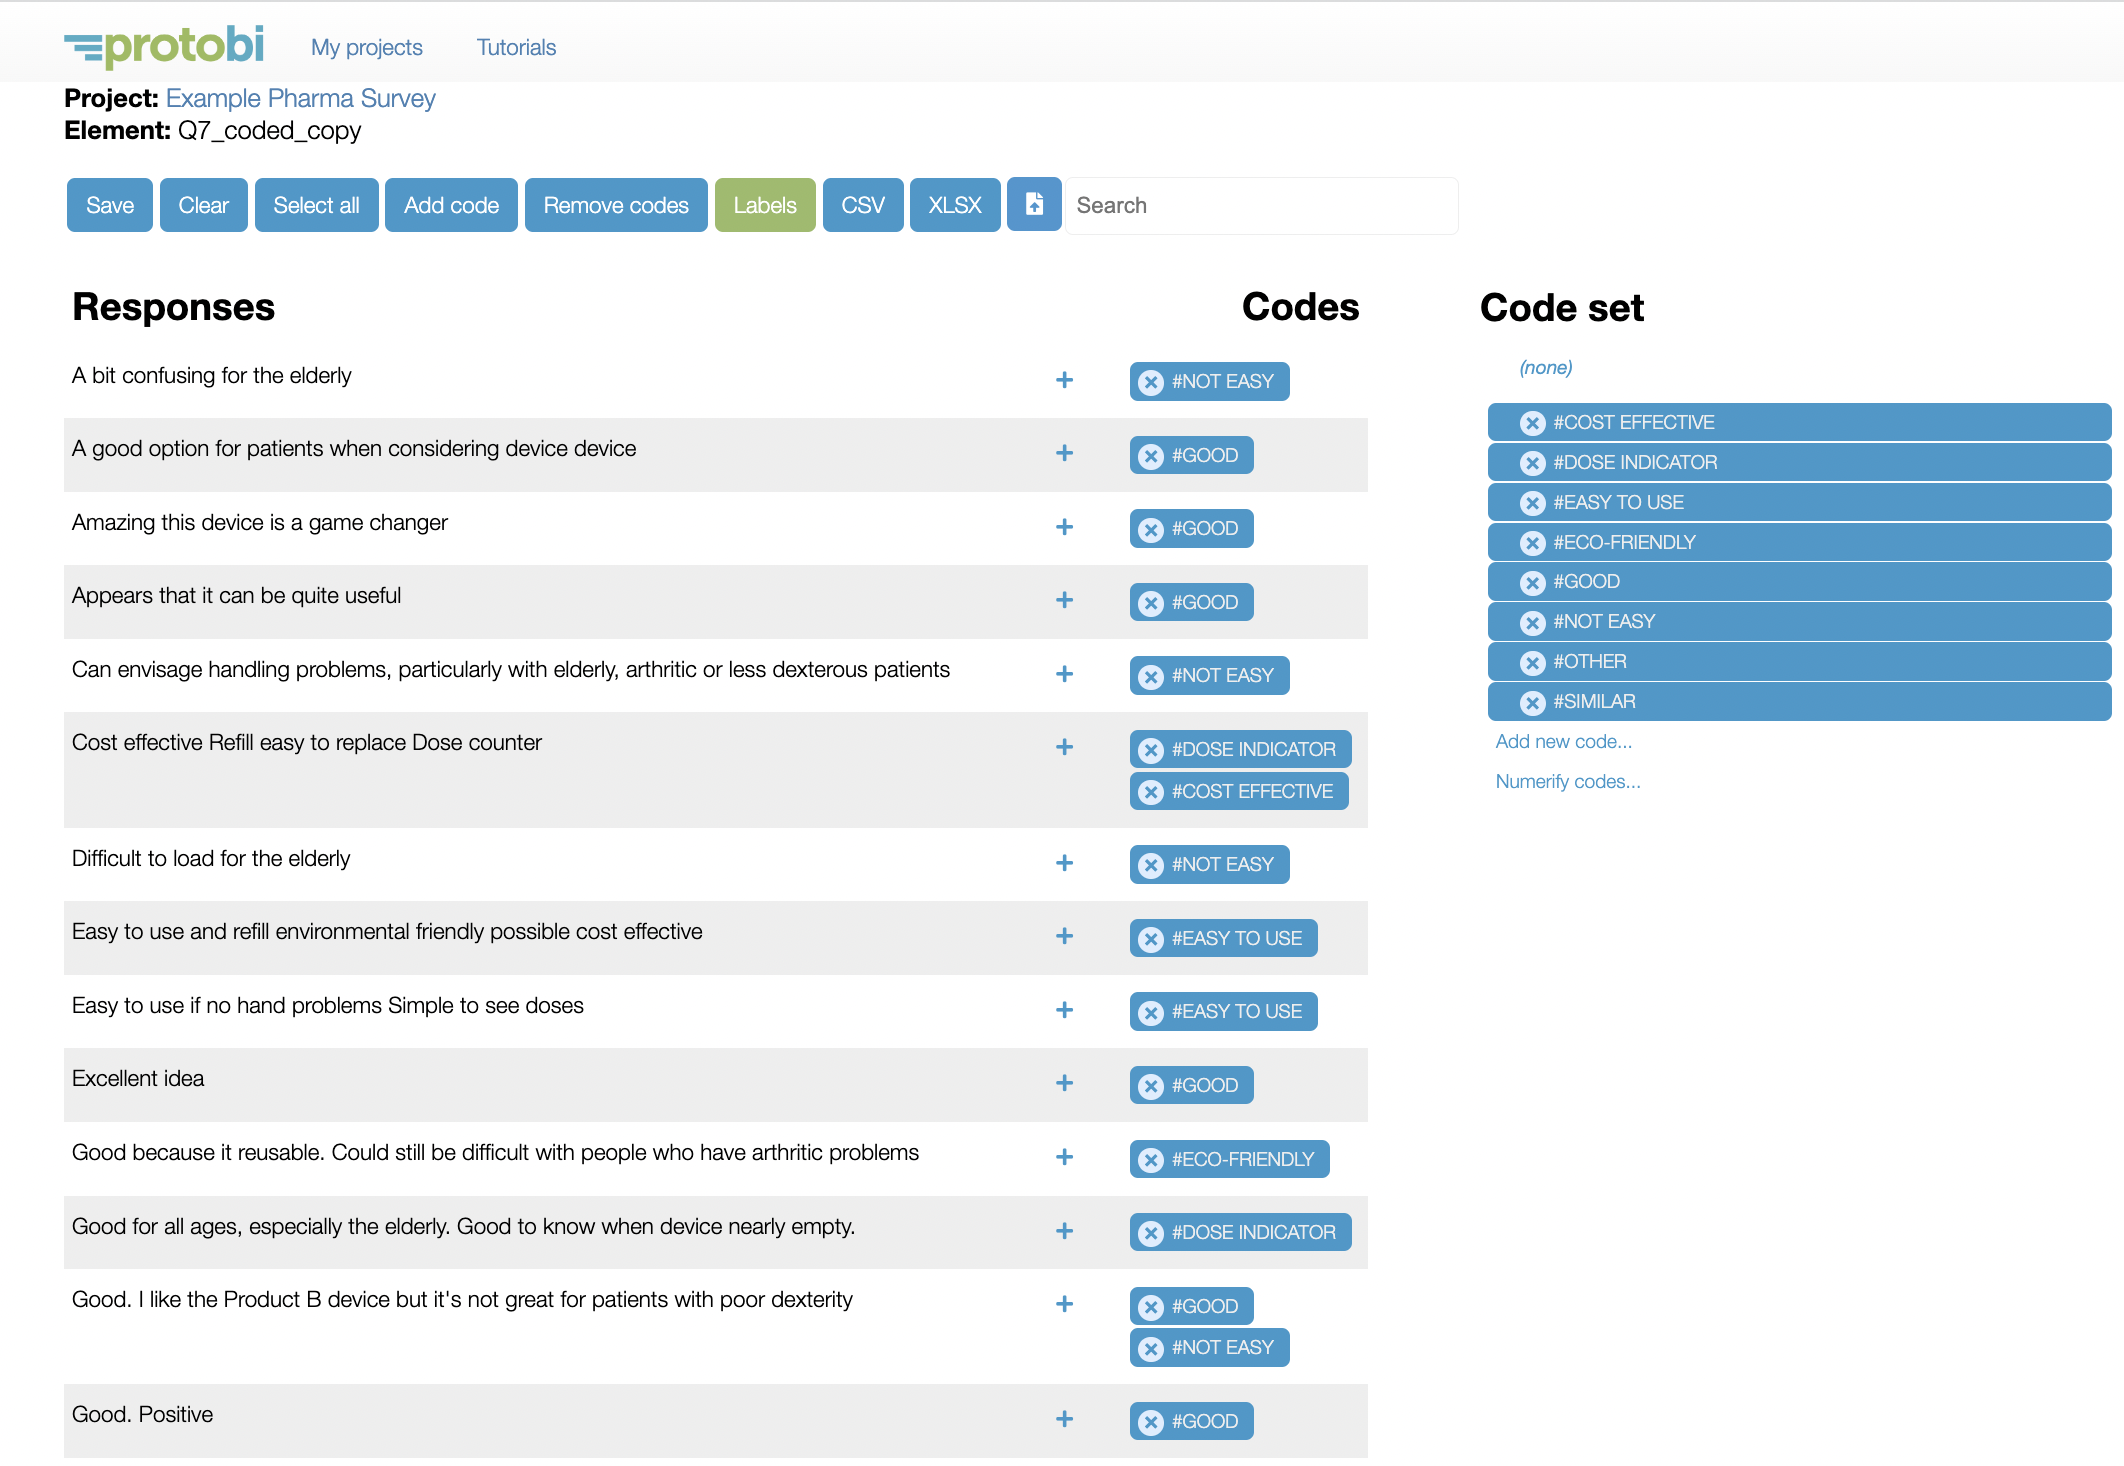
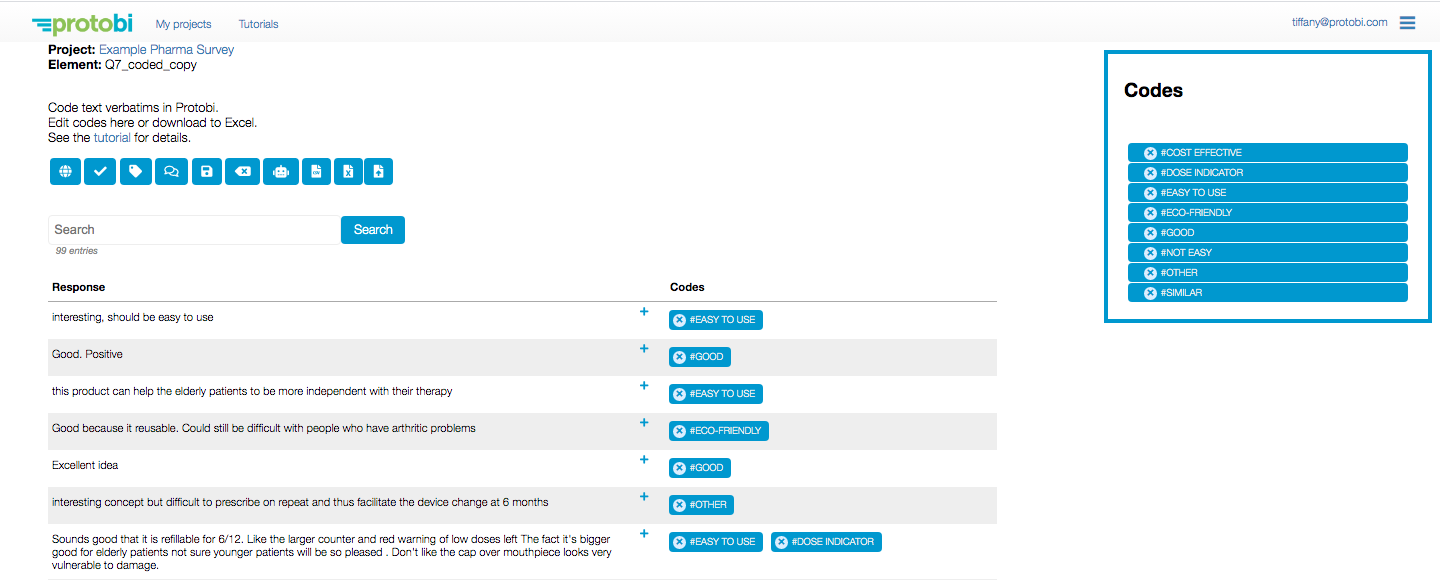
Advanced open-end recoding
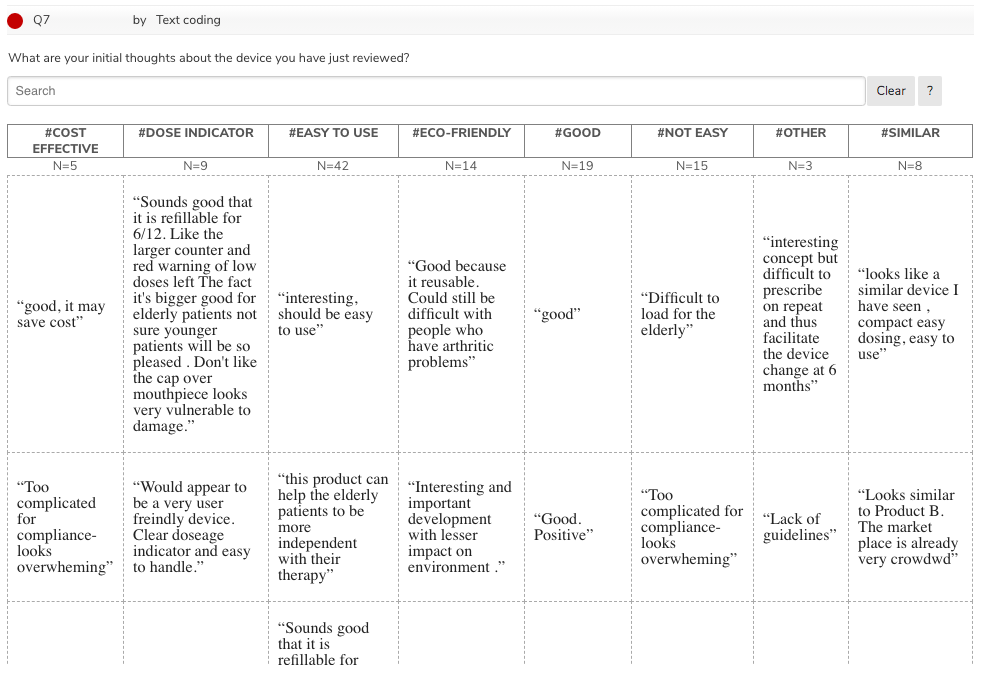
Display open-ends in a grid that shows both raw and coded values
Advanced tool to recode text open-ends
Set up open-end questions for easy recoding
How elements get their data: field, element and transform
Tips for handling open-ends in tracker projects
Tips for open-end recoding
Tracking studies
Move, mirror, clone to organize the view
Global filters
Scenarios
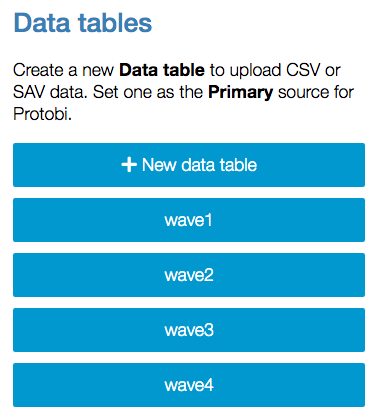
Combine multiple waves of data
Tracking studies
Generate large crosstabs to Excel using Protobi’s SuperTables
Create a new workspace for a tracking study
Chart gallery: save preset chart templates
Set up open-end questions for easy recoding
How elements get their data: field, element and transform
Tips for handling open-ends in tracker projects
NHANES Insights in Protobi
For project admins
Project permissions
Project history
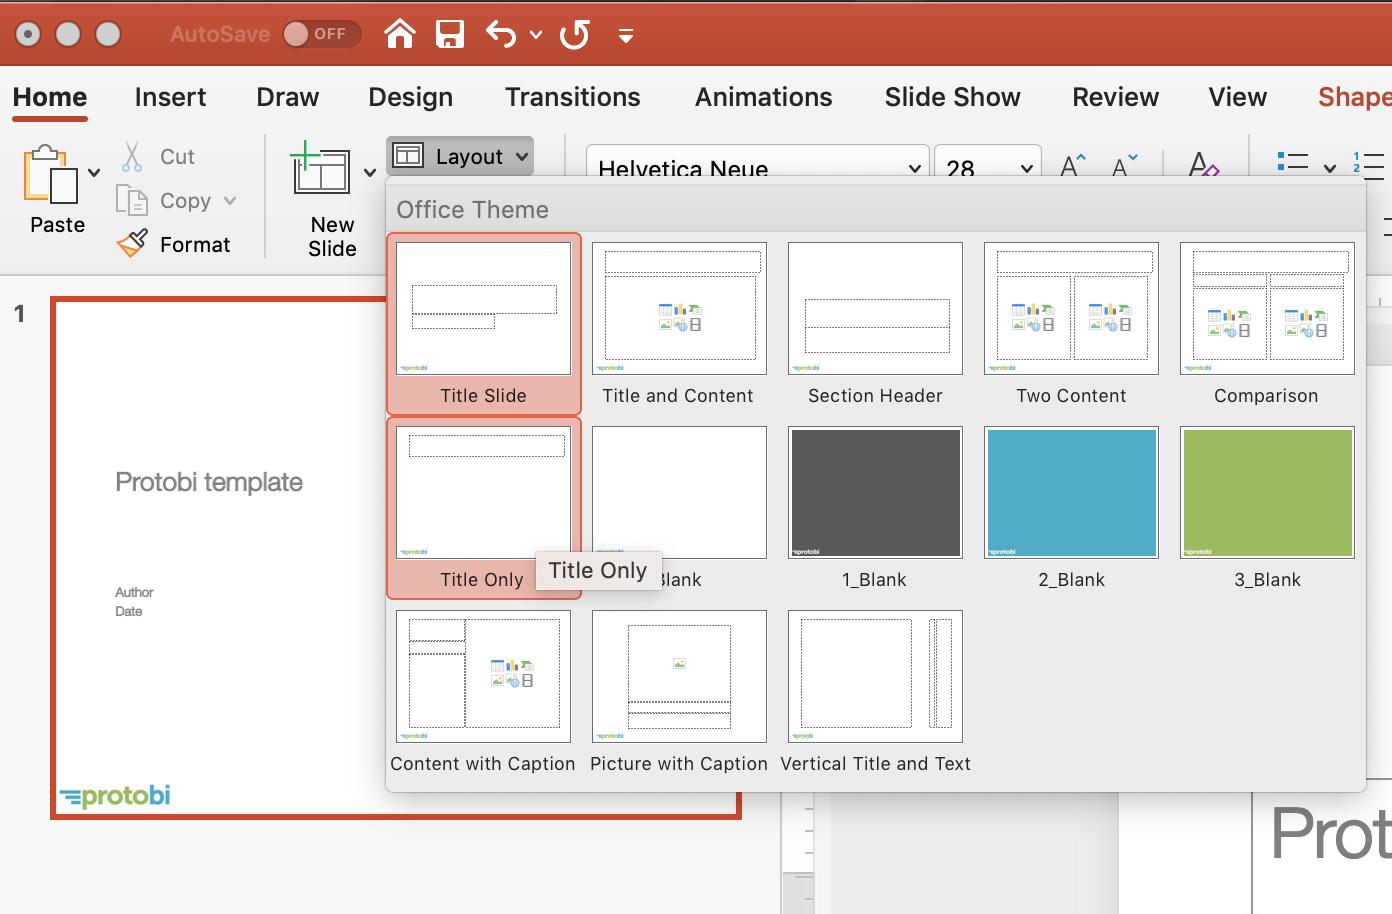
Custom PowerPoint template
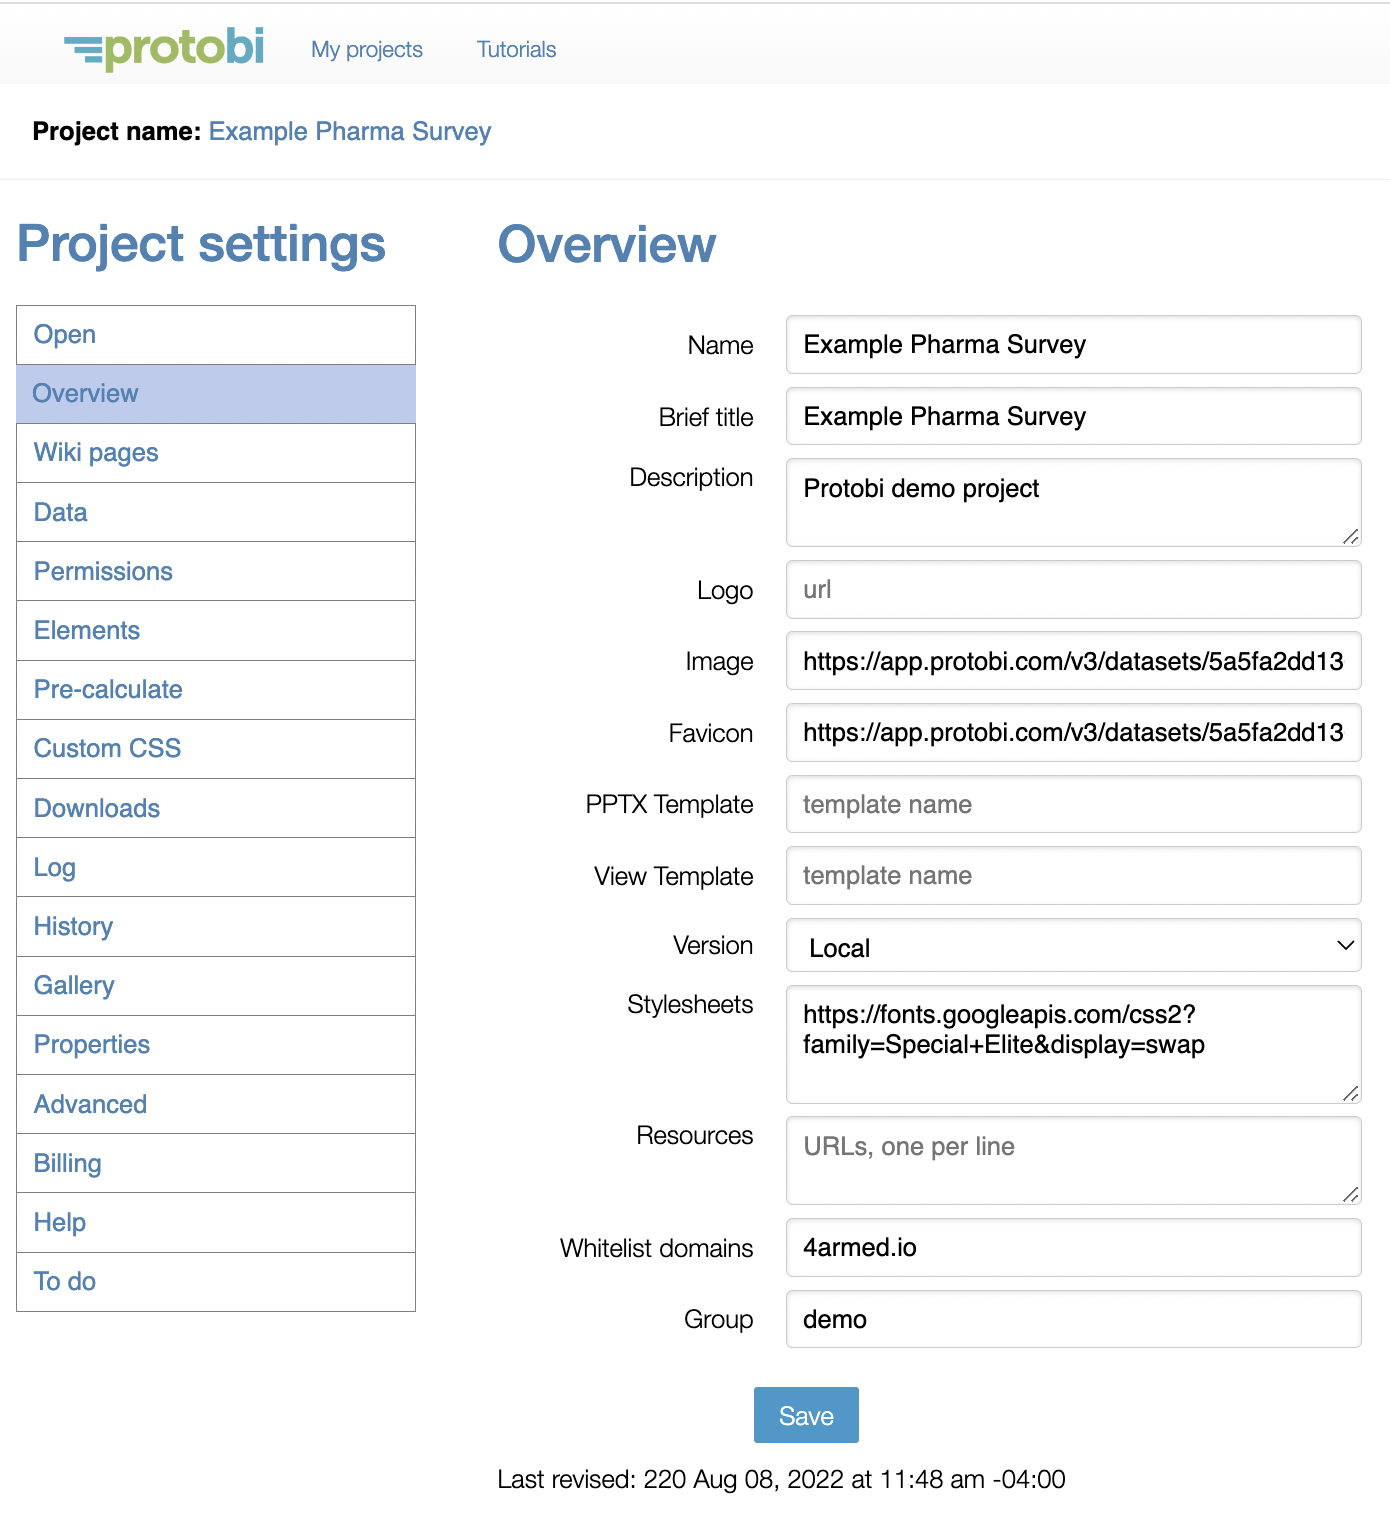
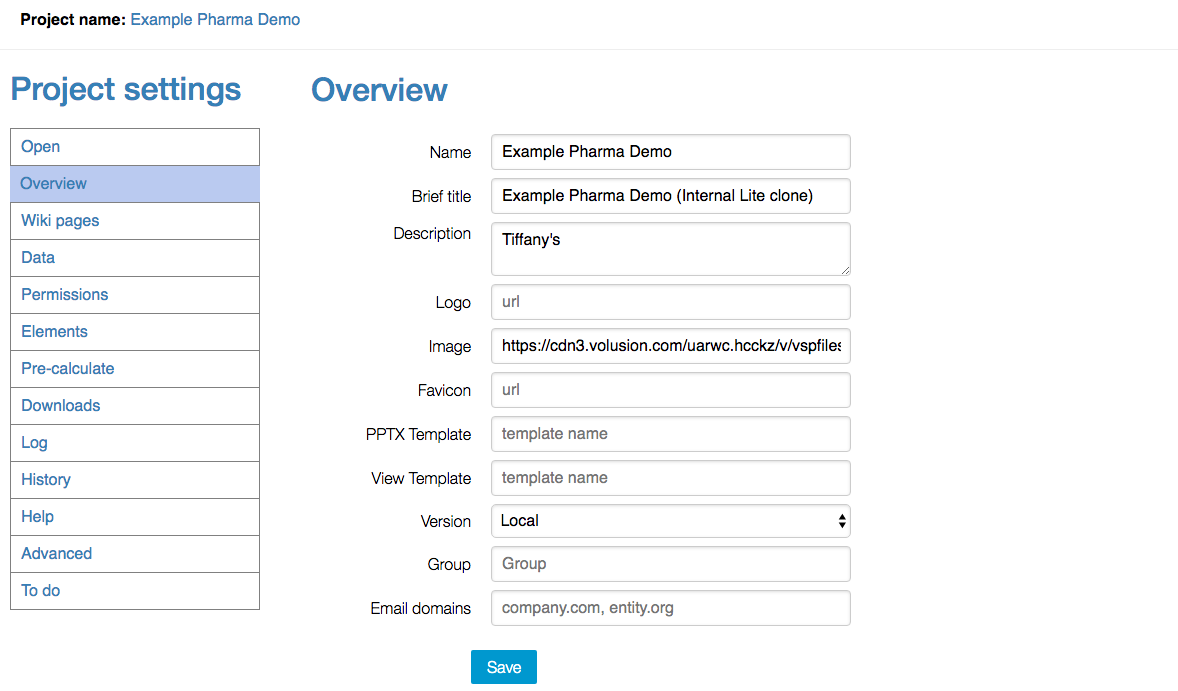
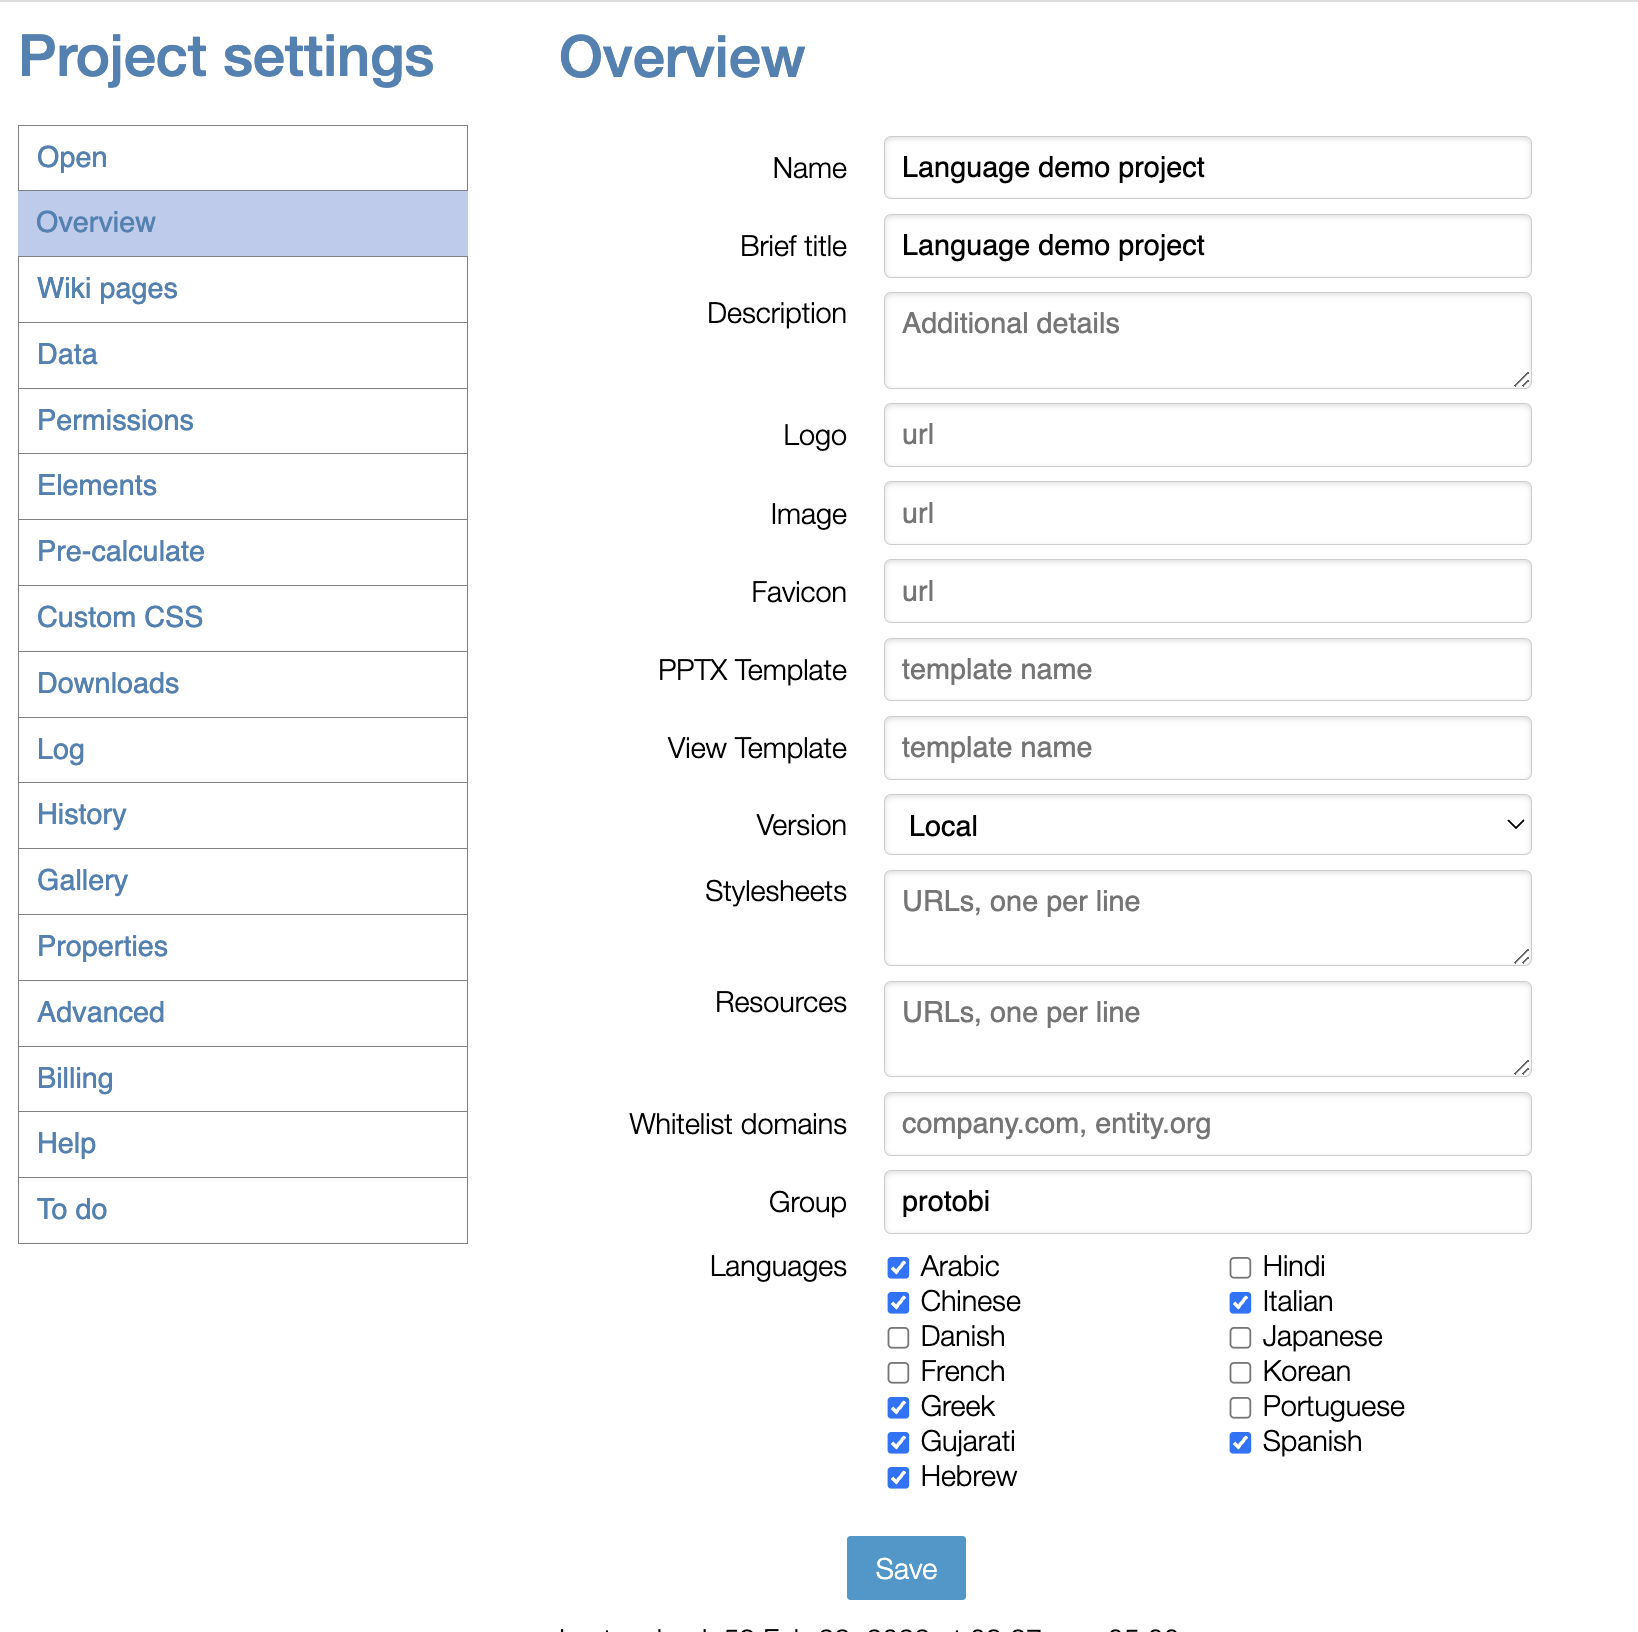
Project overview and branding
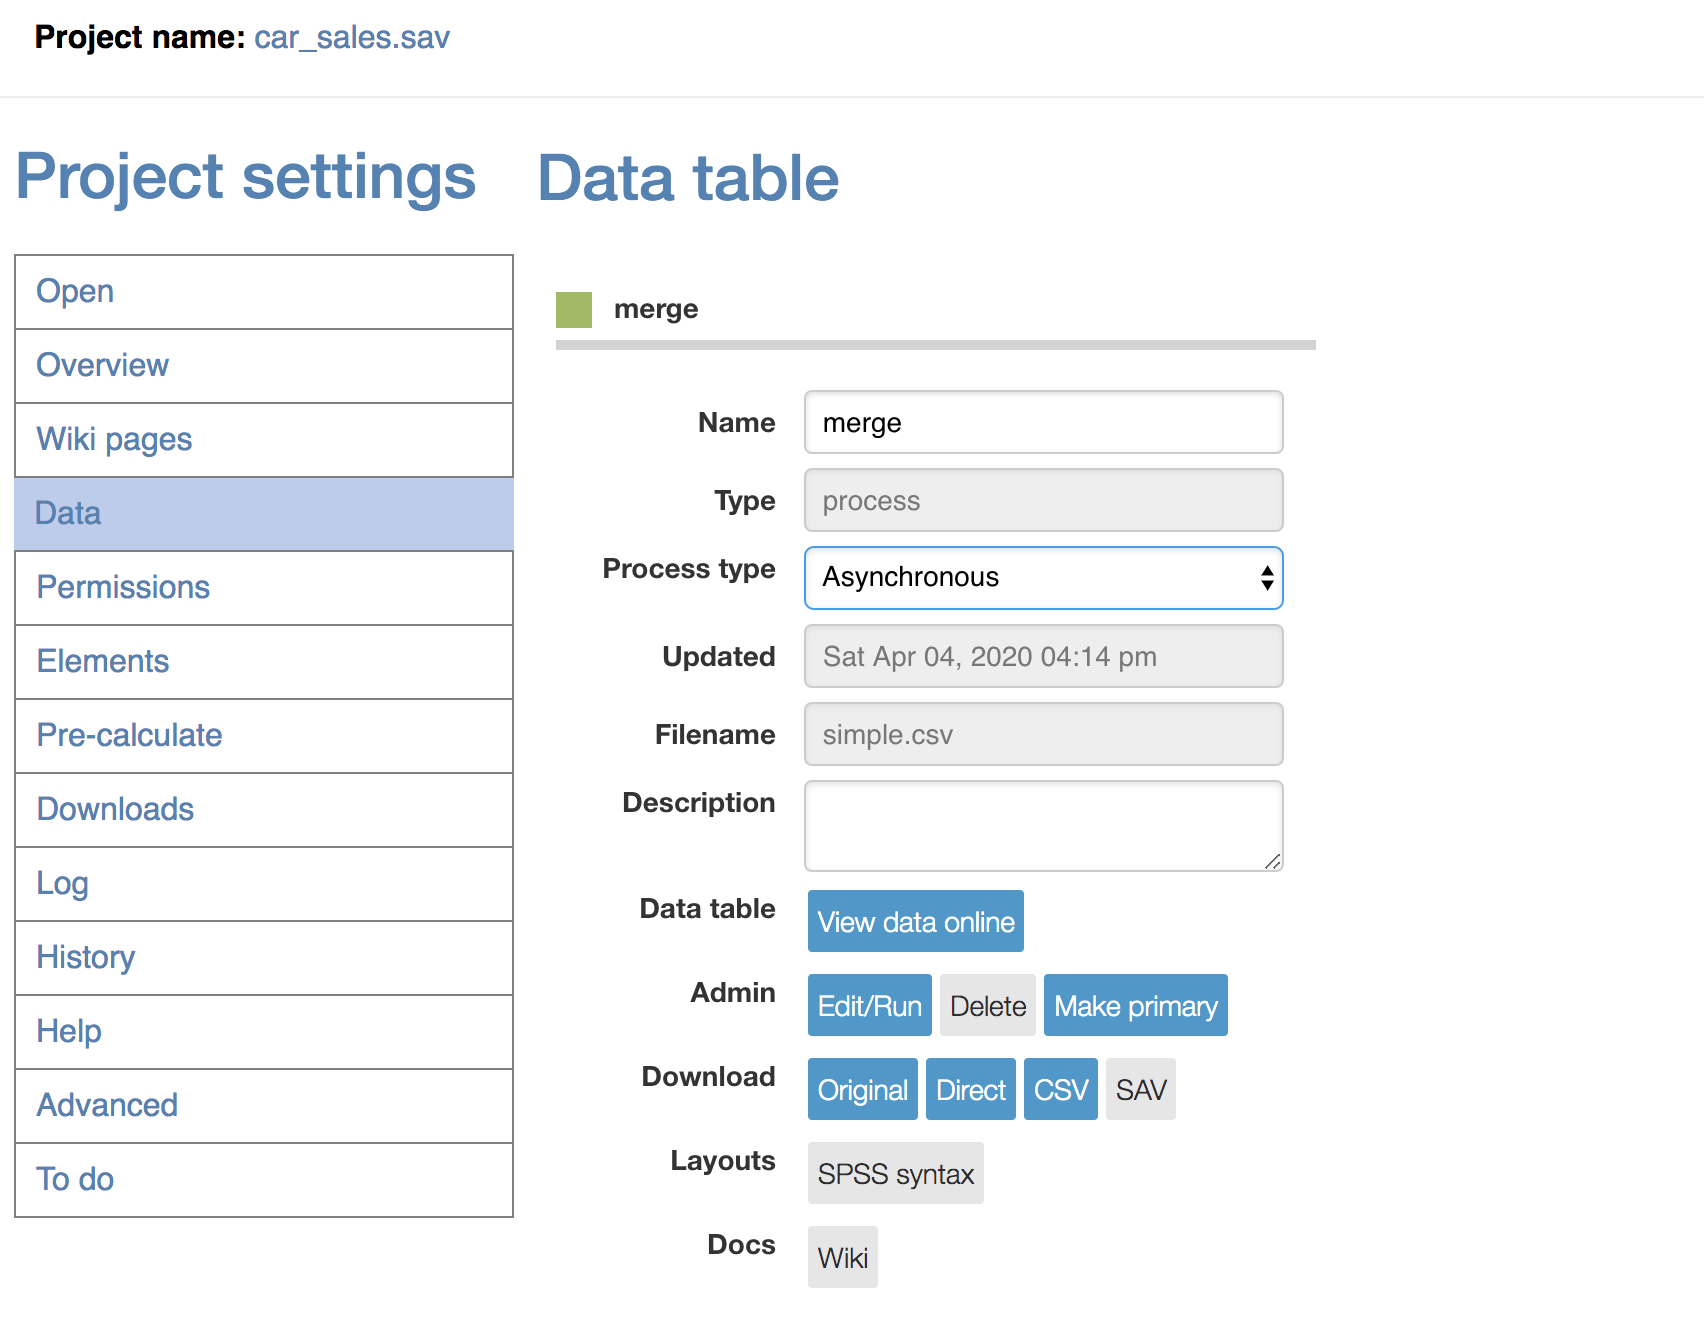
Project data
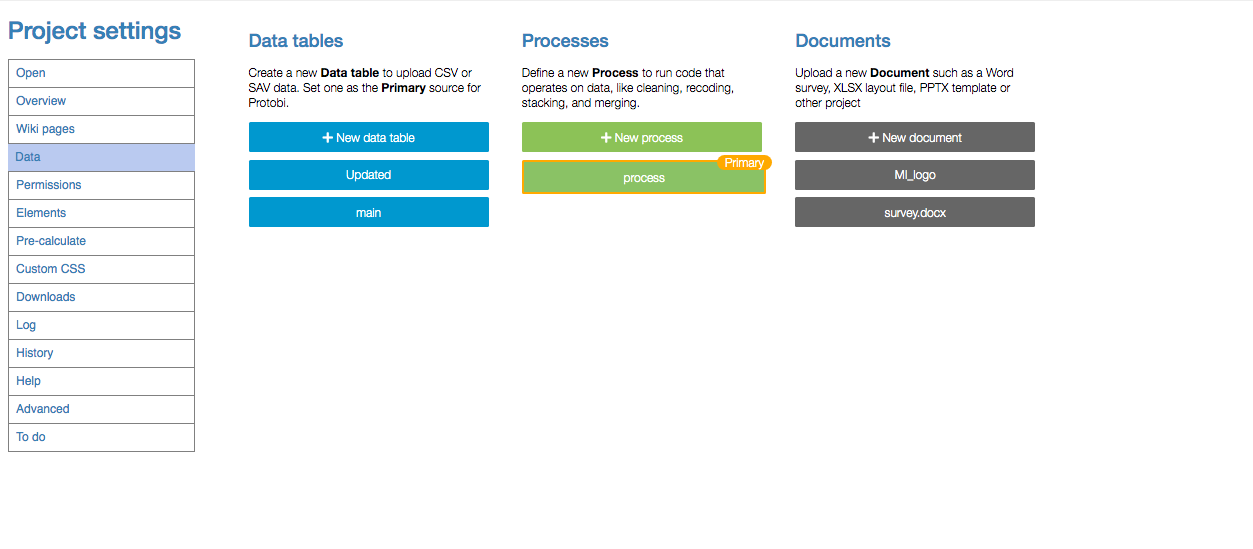
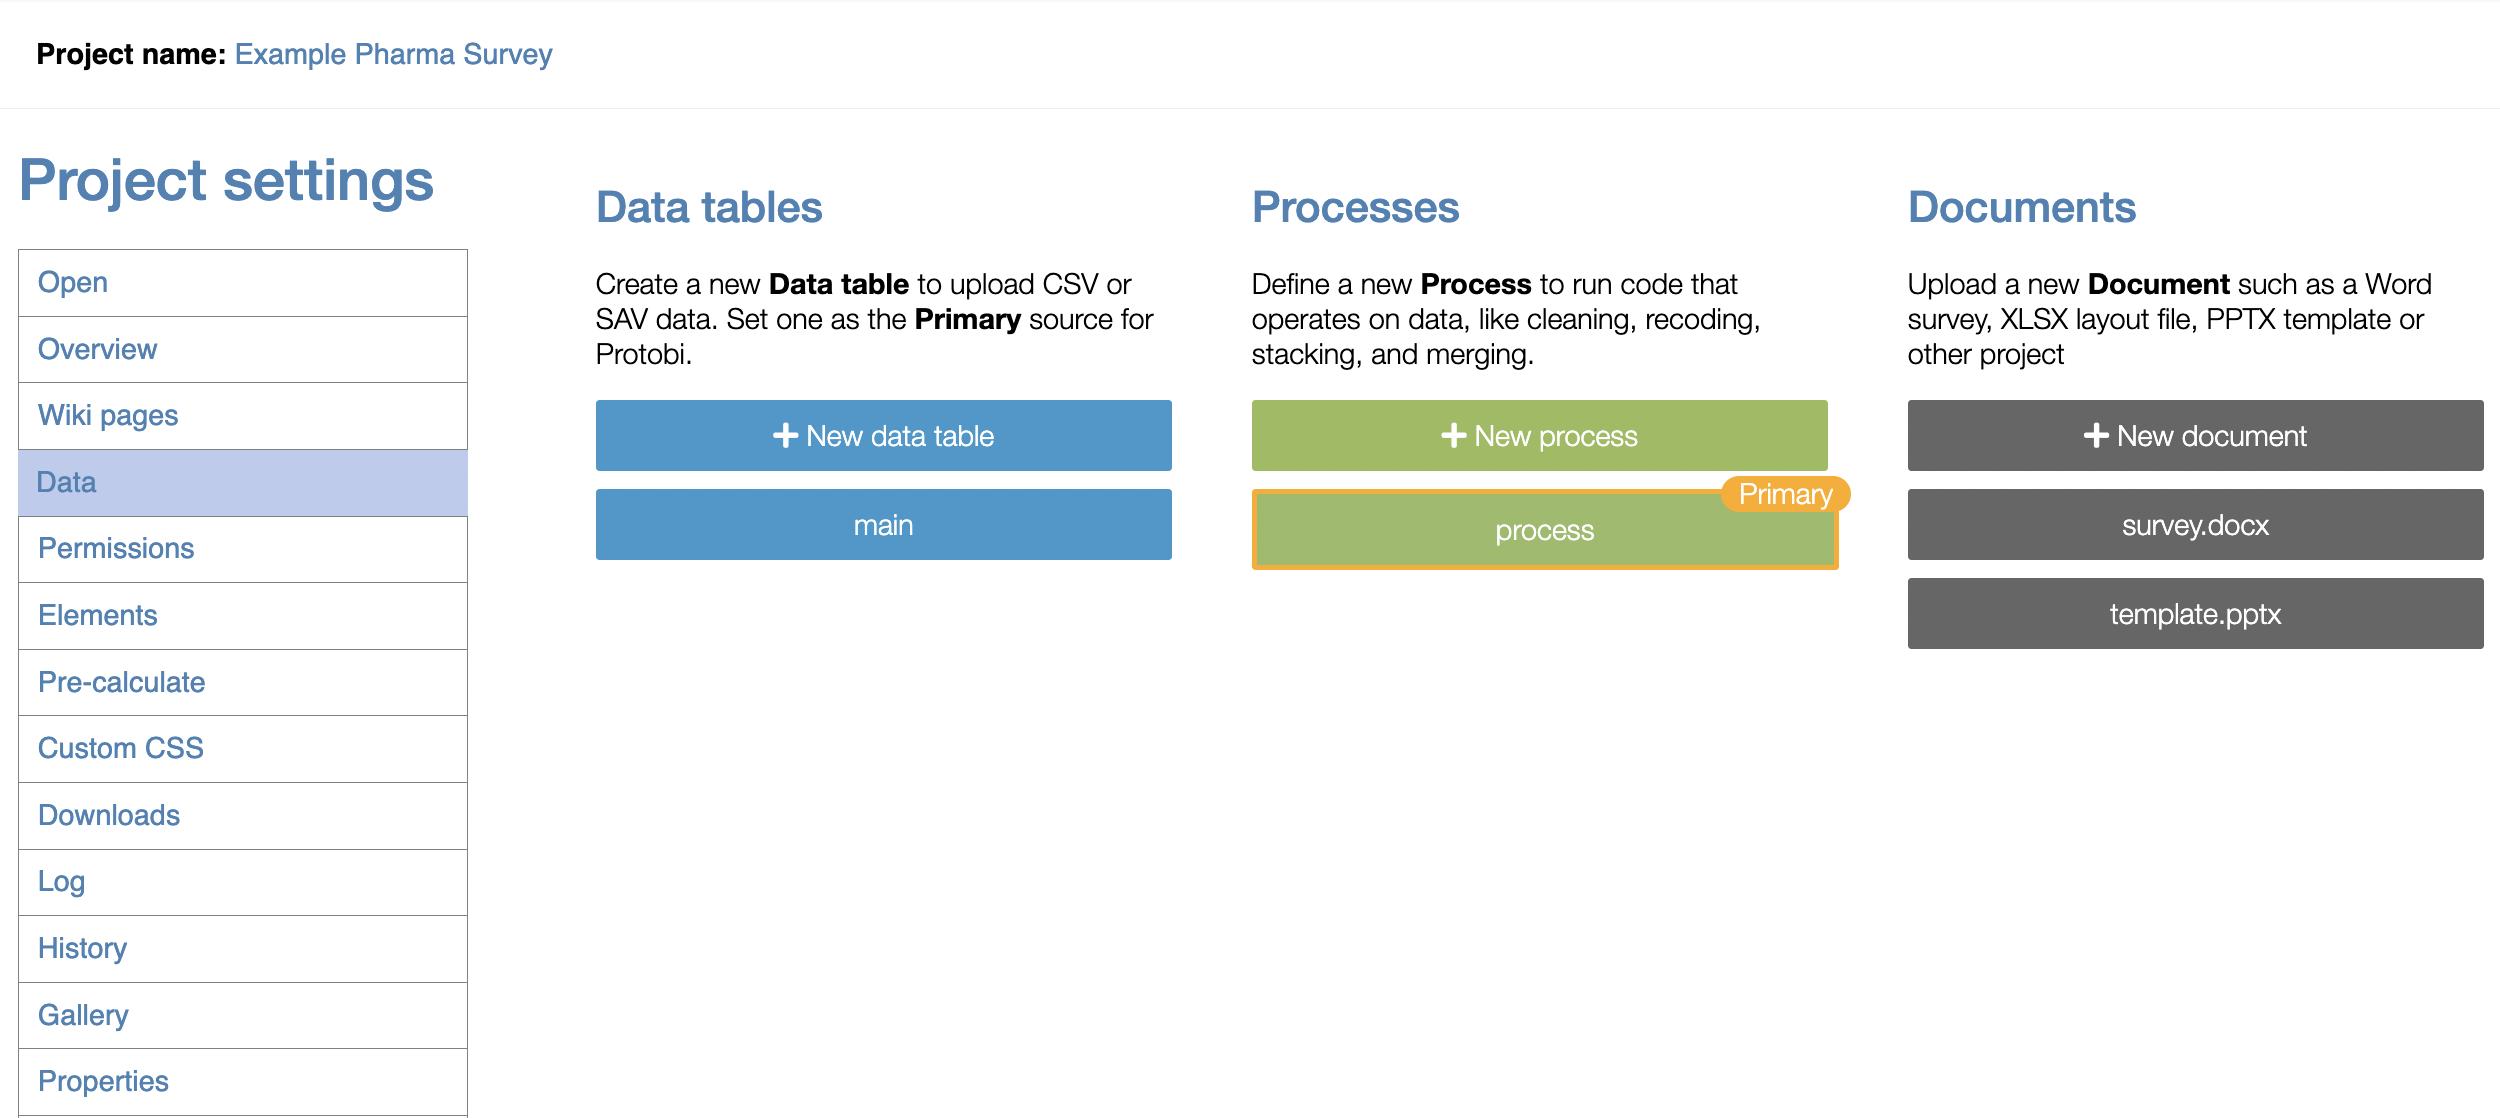
Project settings
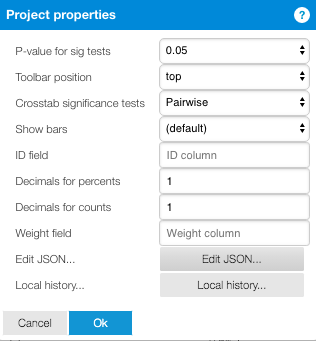
Project properties
Okta authentication
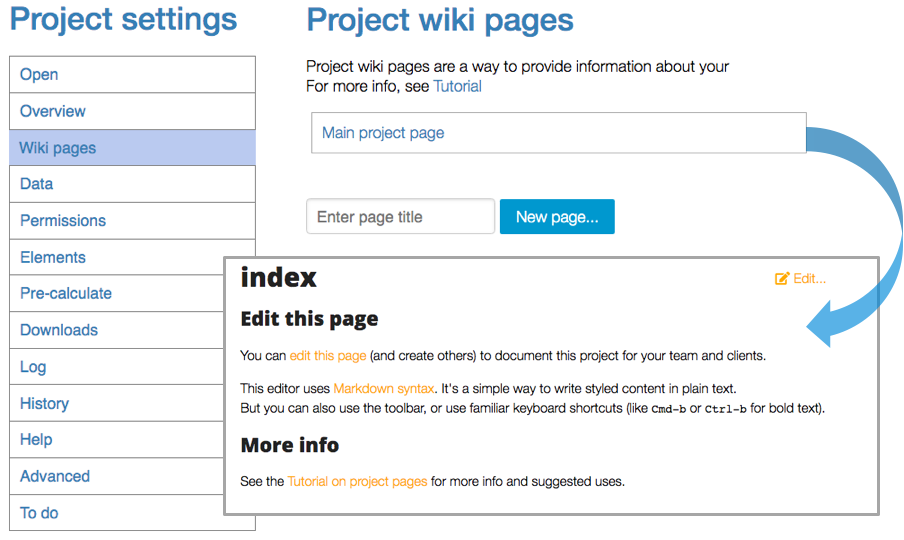
Project wiki pages
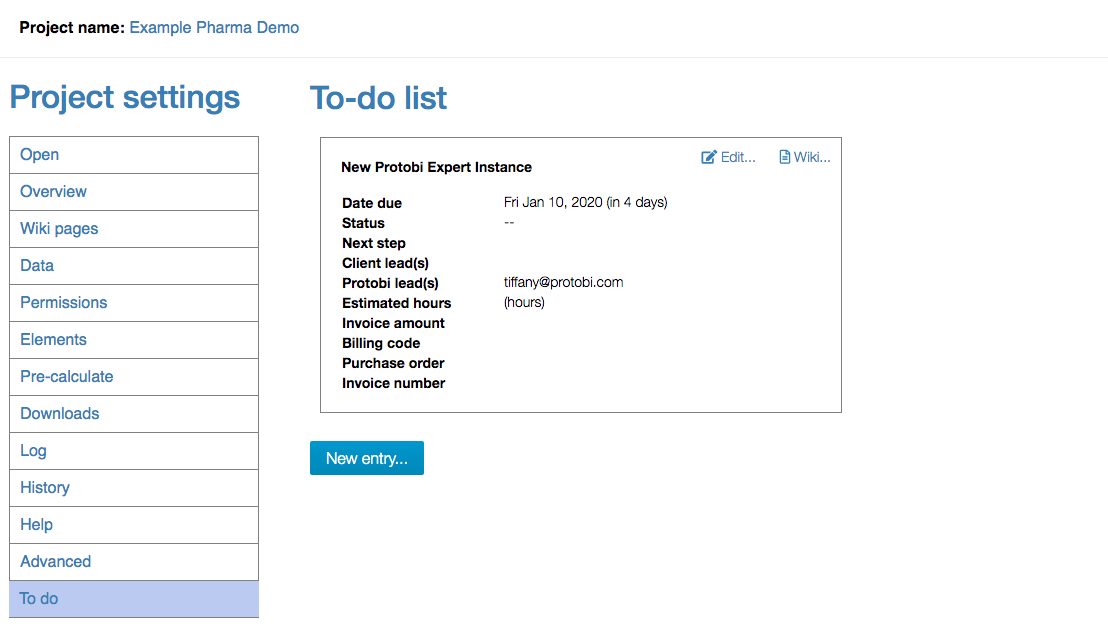
Project to-do
Modify survey data
Stats tests for “statistical significance”
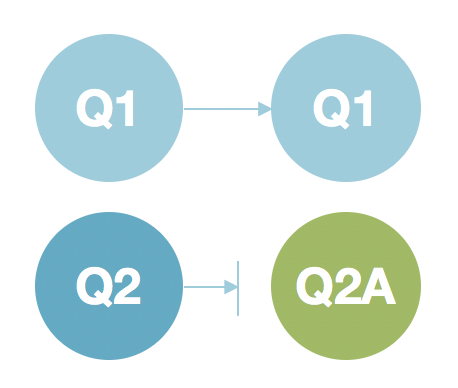
Reconcile question numbers across waves
Tracking studies
Set project language
Project elements
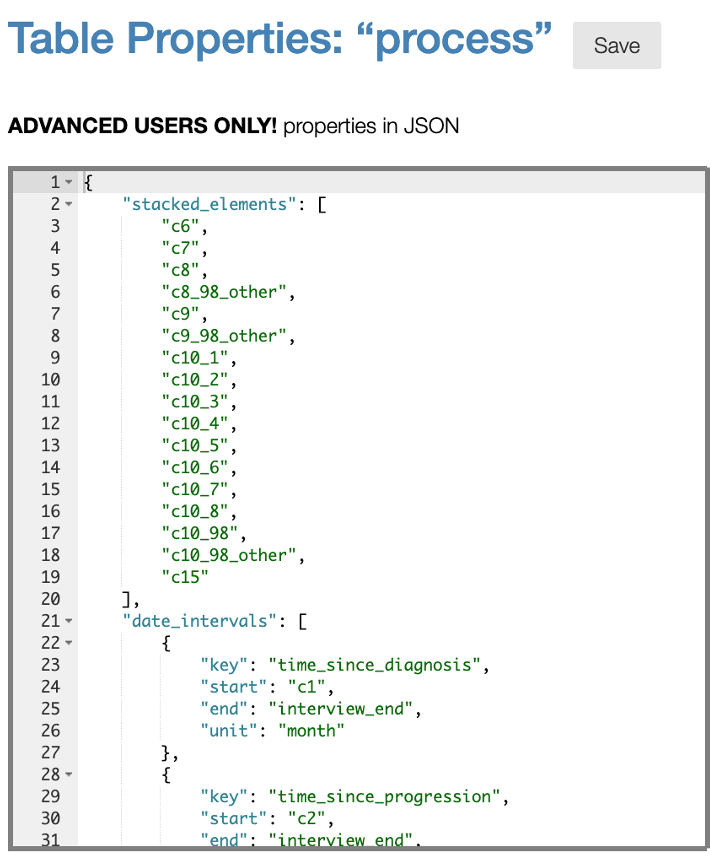
Use table properties to store and retrieve pre-defined variables for data process
Count elements, data columns and rows in a project
Process data in Protobi
Replace missing values with zeros
Filter or remove respondents
Modify survey data
Clean/process data
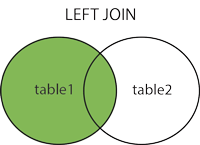
Join additional data to your project
JavaScript basics
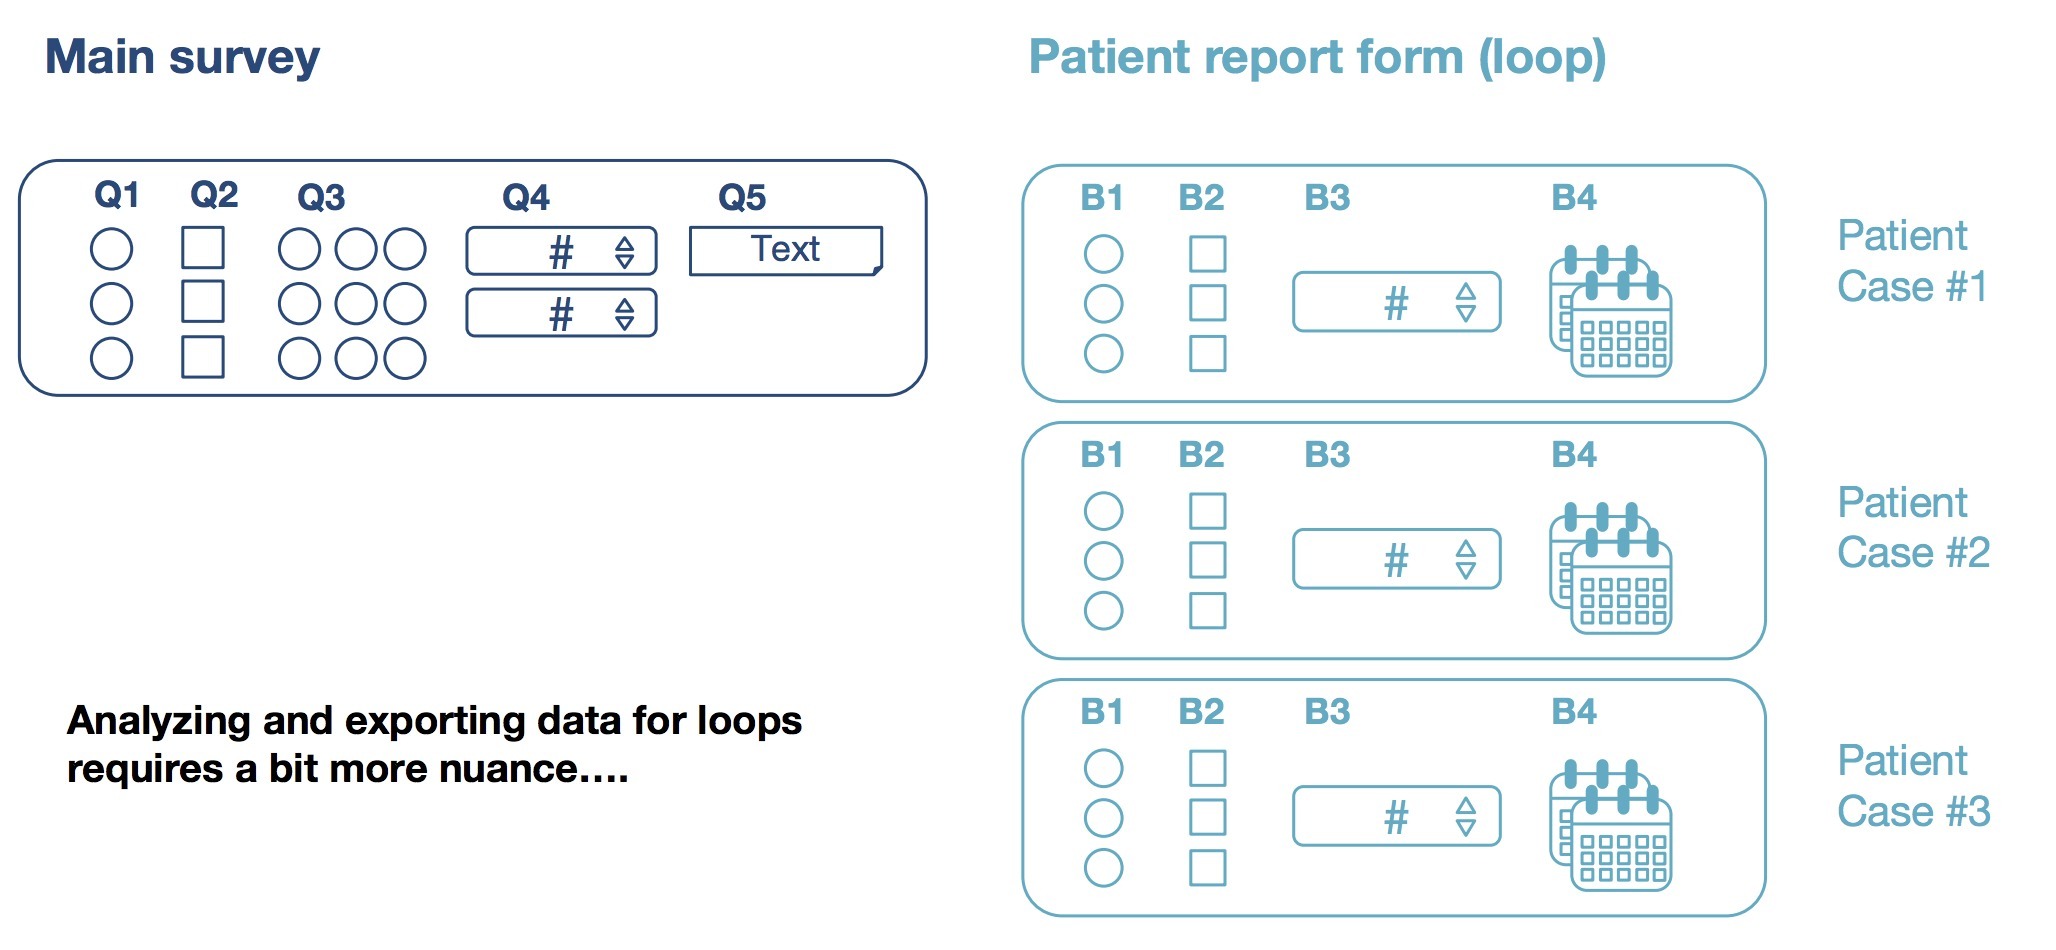
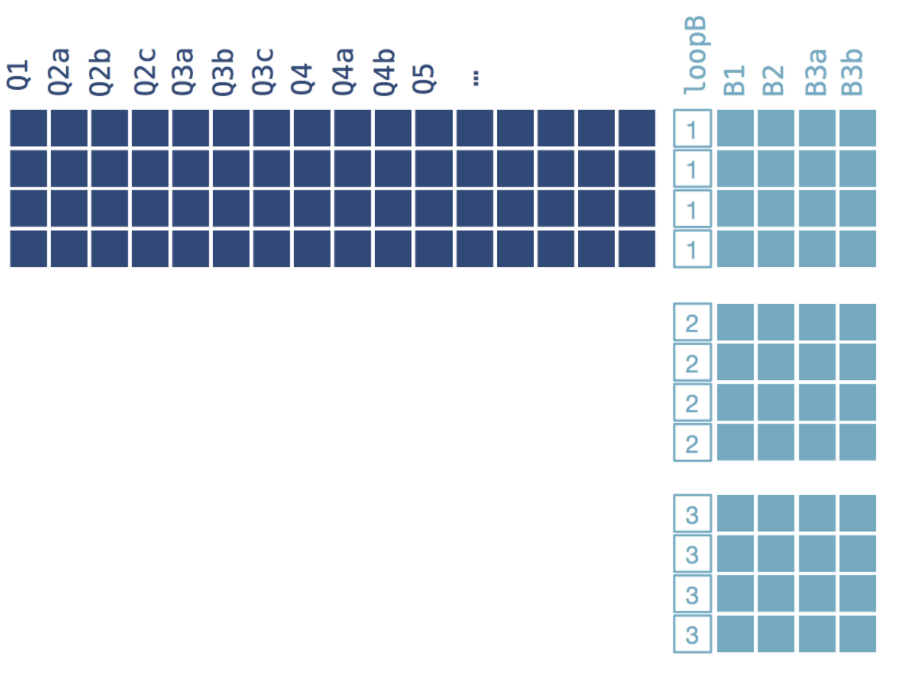
Stack survey data loops
Combine multiple waves of data
Combine data from multiple projects
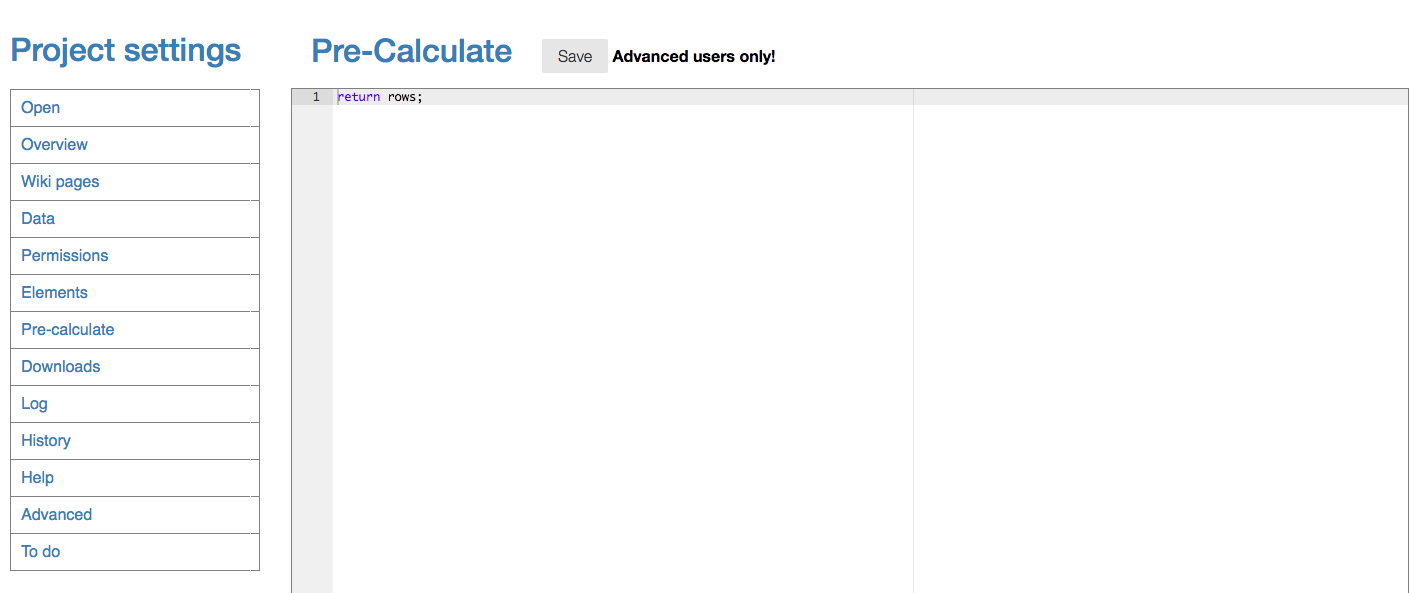
Use JavaScript to process data
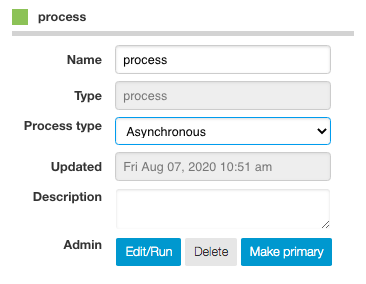
Asynchronous vs Simple data process
Weight to multiple target characteristics
Use loops to write efficient JavaScript
Temper market share data
Use table properties to store and retrieve pre-defined variables for data process
Advanced topics
Putting numbers up front for scale questions
Protobi REST API
Protobi R library
Customize Protobi style
Protobi pages
Survey data loops in Protobi
Cluster analysis and segmentation
Protobi Web API
Import layout data from Confirmit
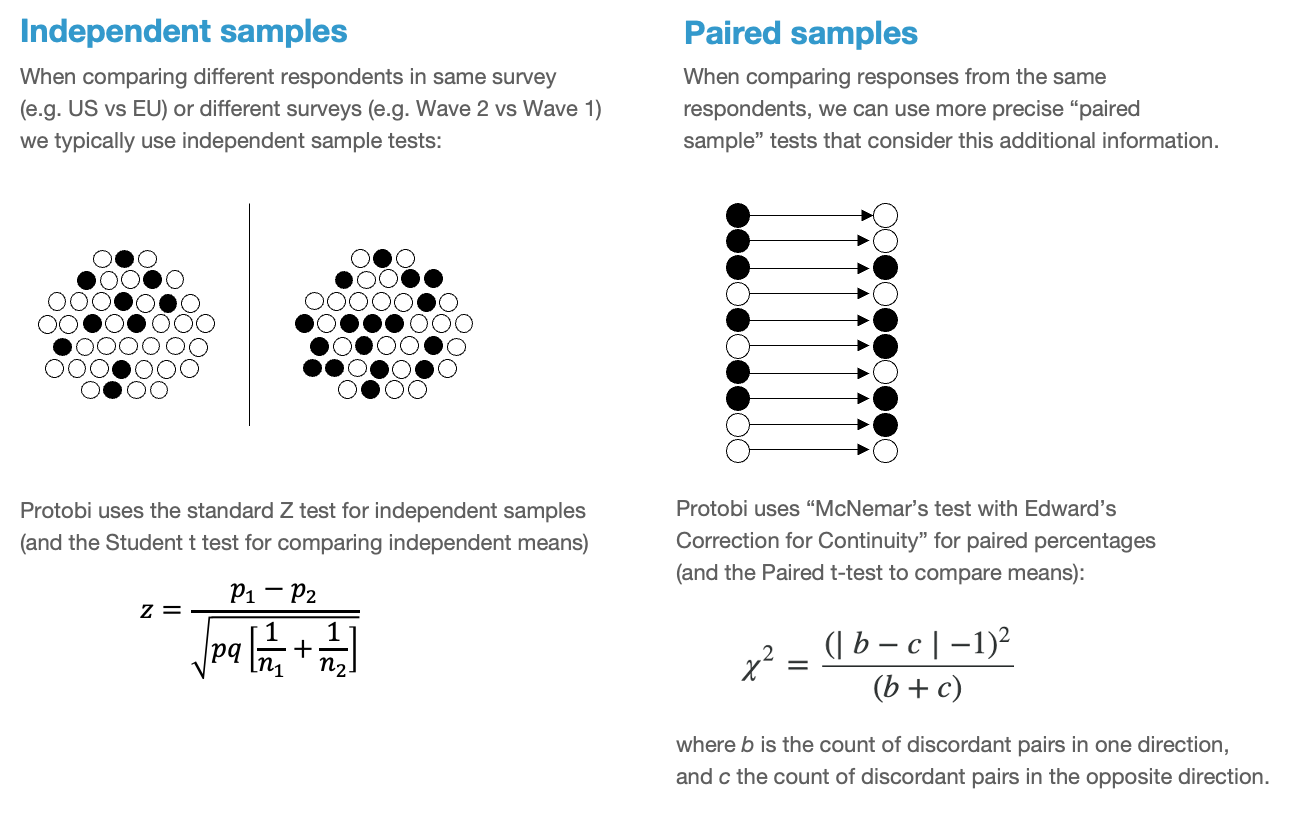
Comparing percentages: Independent vs paired samples
Protobi JSON API syntax
Specify custom stats test algorithms
How to...
Adjust decimals shown
Share a project
Export data from a project
Resize charts
Change toolbar position
Move questions (elements)
Delete elements
Separate words in text open-ends
Upload new data into an existing project
Change sections to a tab view
Search and filter text responses
Group values into custom categories
Create a crosstab
Extract common text from titles
Copy an element into a different tab
Edit display keys and titles
Clone an element within the same tab
Compact set of questions
Include a response in multiple codes
Set project default to not show NA
Open a project
Group questions together
Exclude zero values from stats
Replace response values or characters
Show text that is cut off
Show N size for a group of elements
Copy titles from all children of one group to another
Select elements to export, group, etc...
Add a project intro
How to remove decimals from bins
Hide toolbar buttons
Add a new tab
Create a new element
Hide tabs from view users
Blank titles in compact groups
Save project changes
Drill into a subset of respondents
Videos
Intro to Protobi
Get started
Press to drill in
Toggle percentages & counts
Missing values
Bin ranges for numeric questions
Crosstabs
Checkboxes & Numeric grids
Search and filter text open-ends
Cloud translations
Chart types
Ratings questions
Create a new project
Export to PowerPoint & Excel
Testing video keyword
Let's make a word cloud
Project flow
Clone elements
Recode text for analysis
Organize the data view
Weight data
Calculate ratios
Import a new data set
Condense ranking questions into a compact view
Condense text open-ends video
"is," "or," and "not" queries
Calculate simple ratios
Advanced tool to recode text open-ends
Intro to Protobi
Tips for open-end recoding
Create and export stylized crosstab tables
Troubleshooting
Troubleshooting
API References
Protobi REST API
Toolbar shortcuts cheat sheet
Protobi Web API
API reference sheets
Protobi JSON API syntax
How to use Embedded JavaScript in Protobi
Protobi JavaScript API cheatsheet
Protobi Chart Types JSON Reference