Toggle navigation
Home
▼ Details
Products and pricing
Chart gallery
User stories
Text analytics
CDC NAMCS Library
Blog
Tutorials
Contact
Sign in
Basics for editors
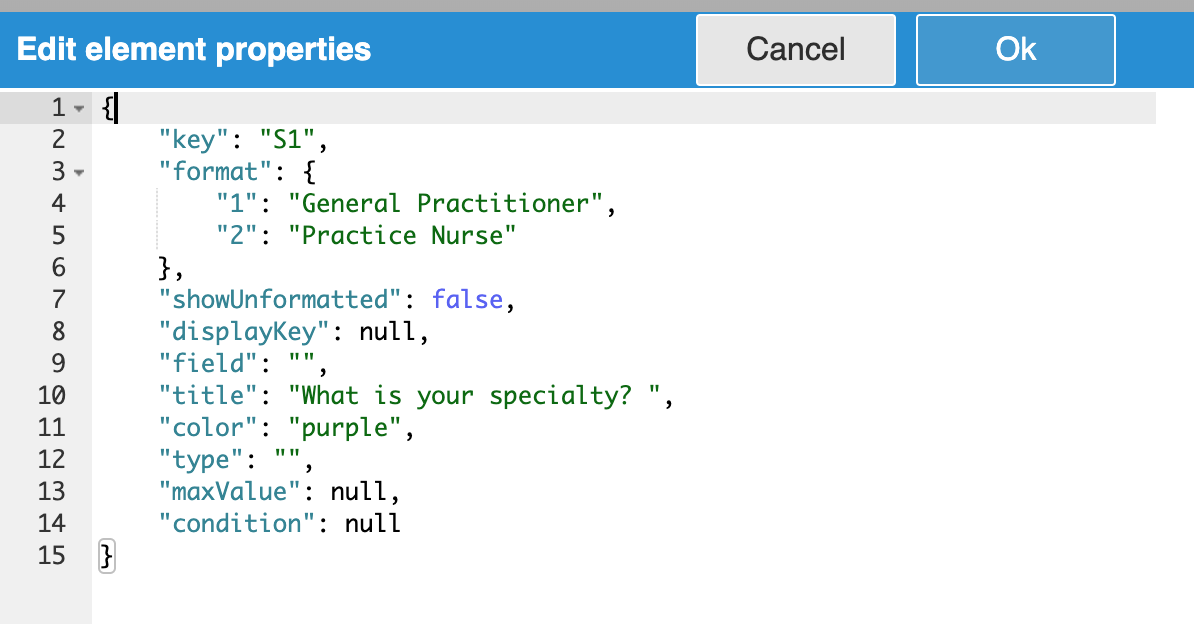
JSON editor
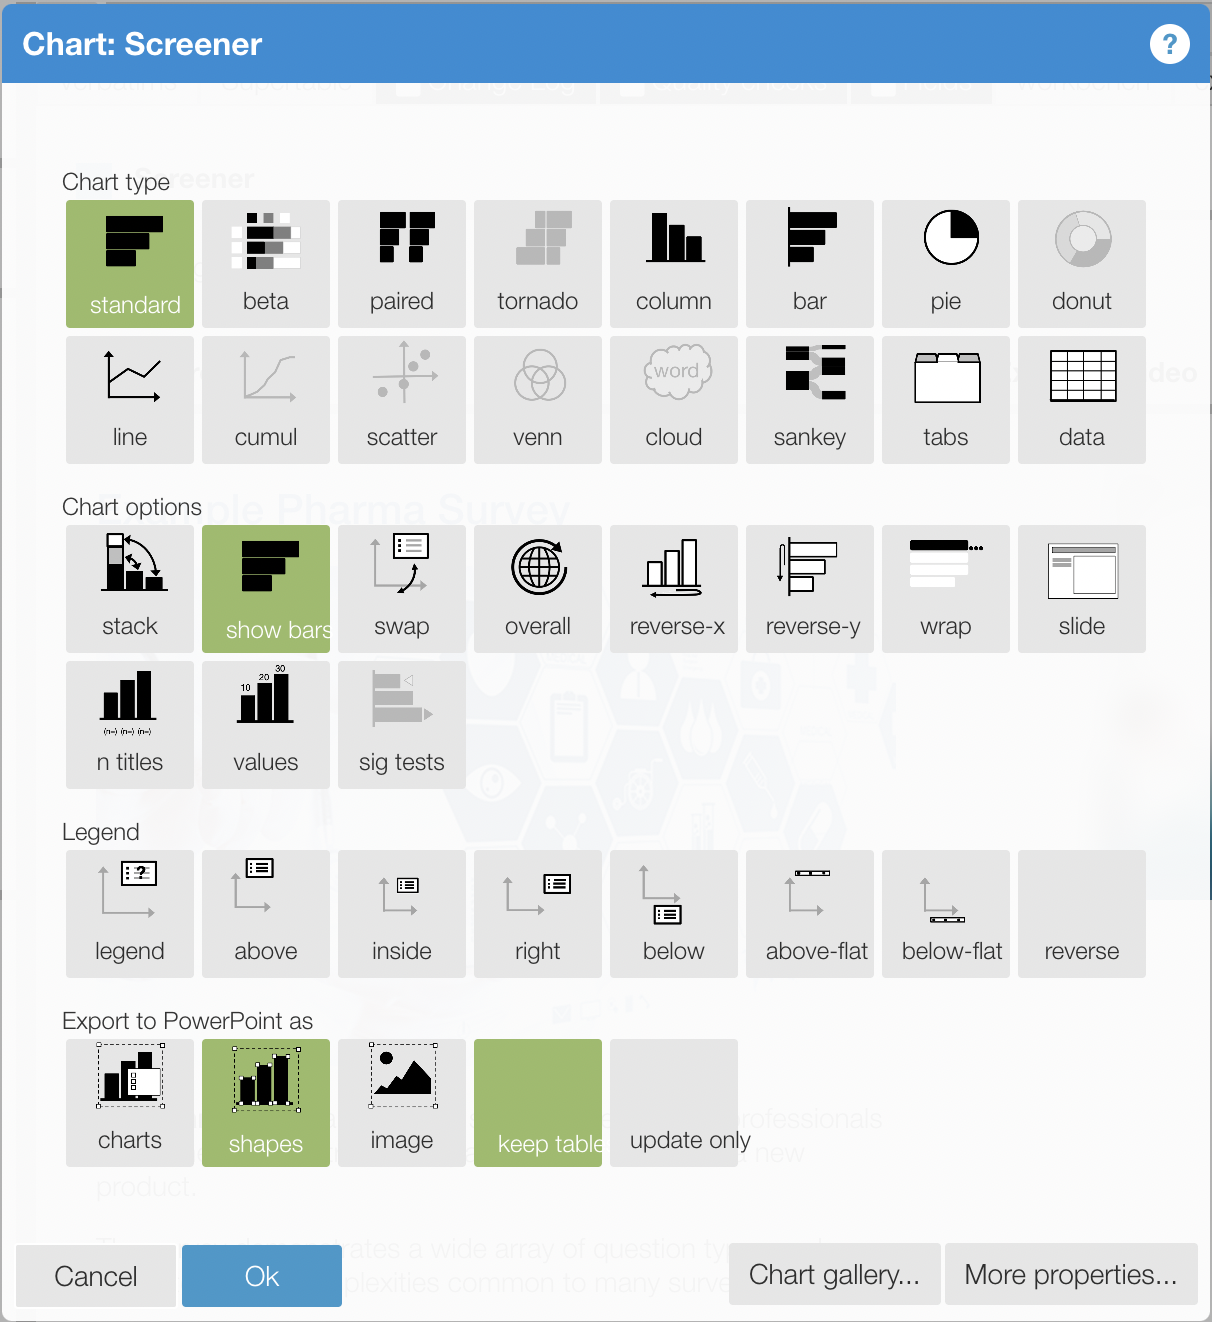
Chart types
Compact to turns grid questions into a concise view
Calculating ratios
Bin values into numeric ranges
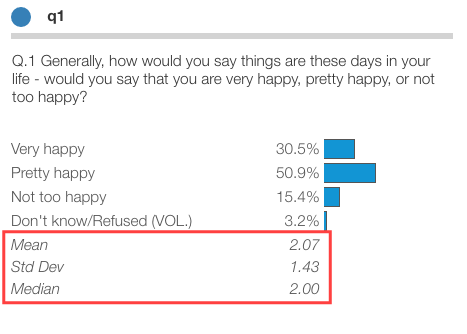
Summary statistics
Extract common text from titles
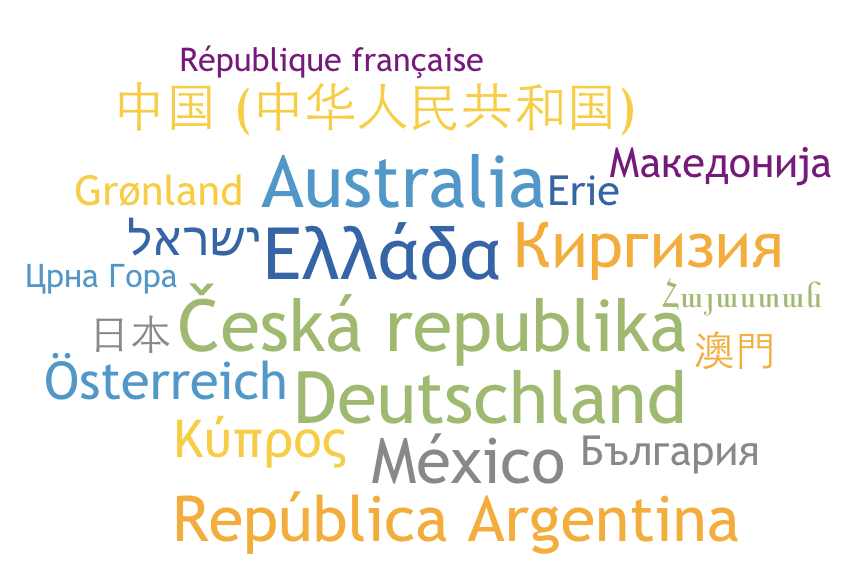
Translate languages
Ways to display rankings
Colors
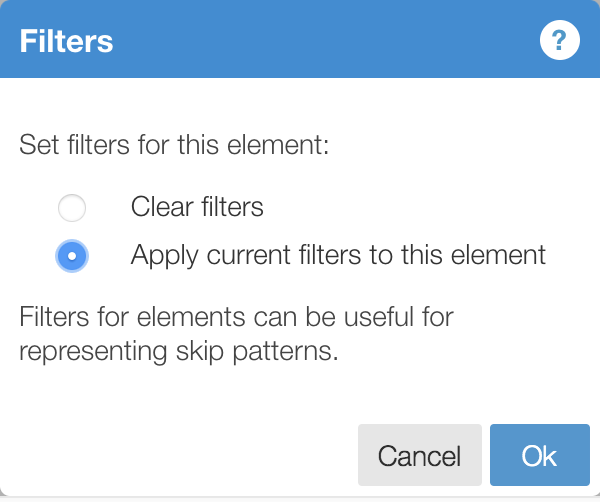
Element specific filters
Use Autogroup to quickly organize your survey
Value formats
Headline, title, display key and footnote
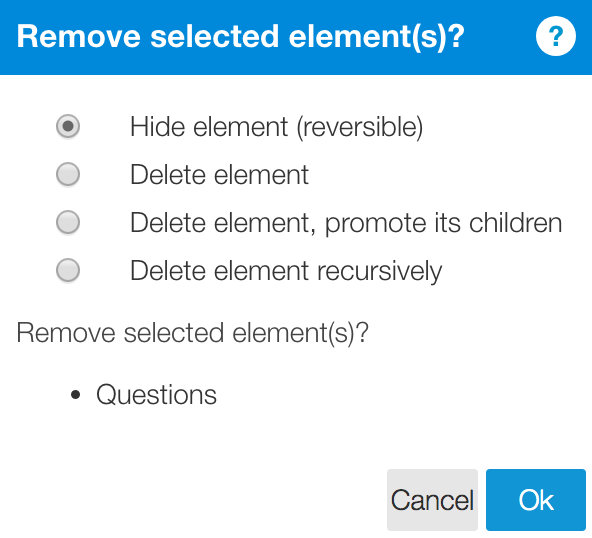
Hide or delete
Simple open-end recoding
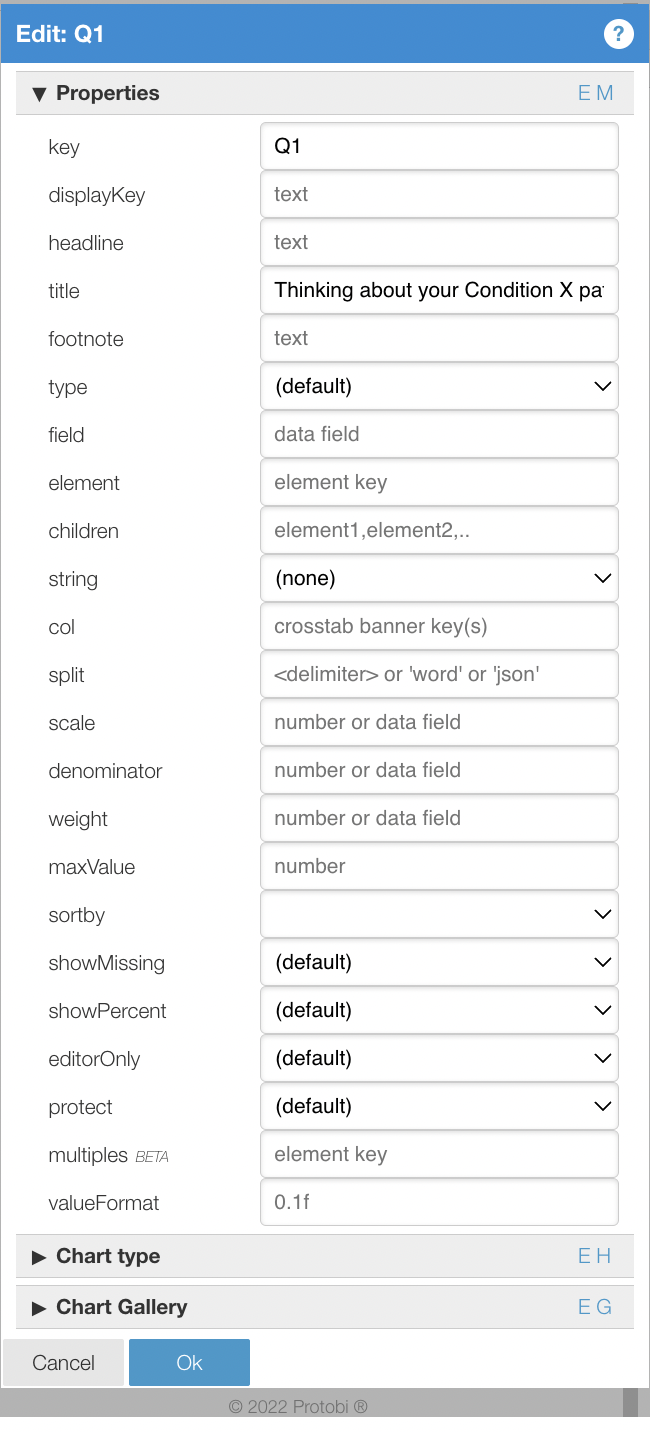
Edit properties dialog
Use alternative values to calculate summary statistics
Basic project setup
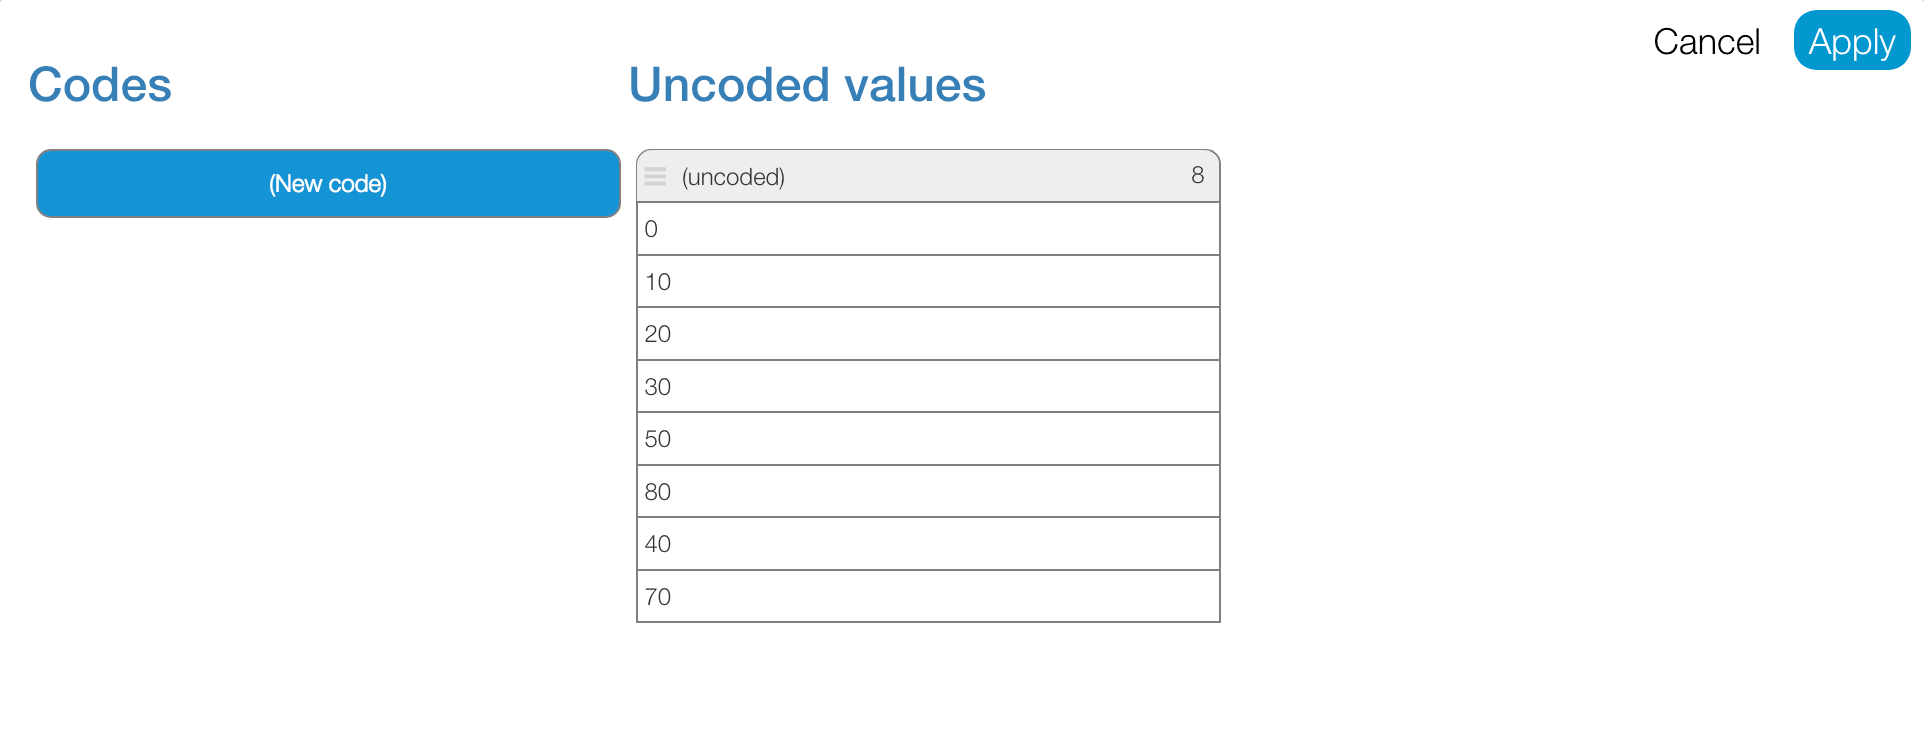
Recode dialog
Notes
Apply skip logic
More chart properties
Tips to design neat and engaging projects
Editor Panel
How elements get their data: field, element and transform
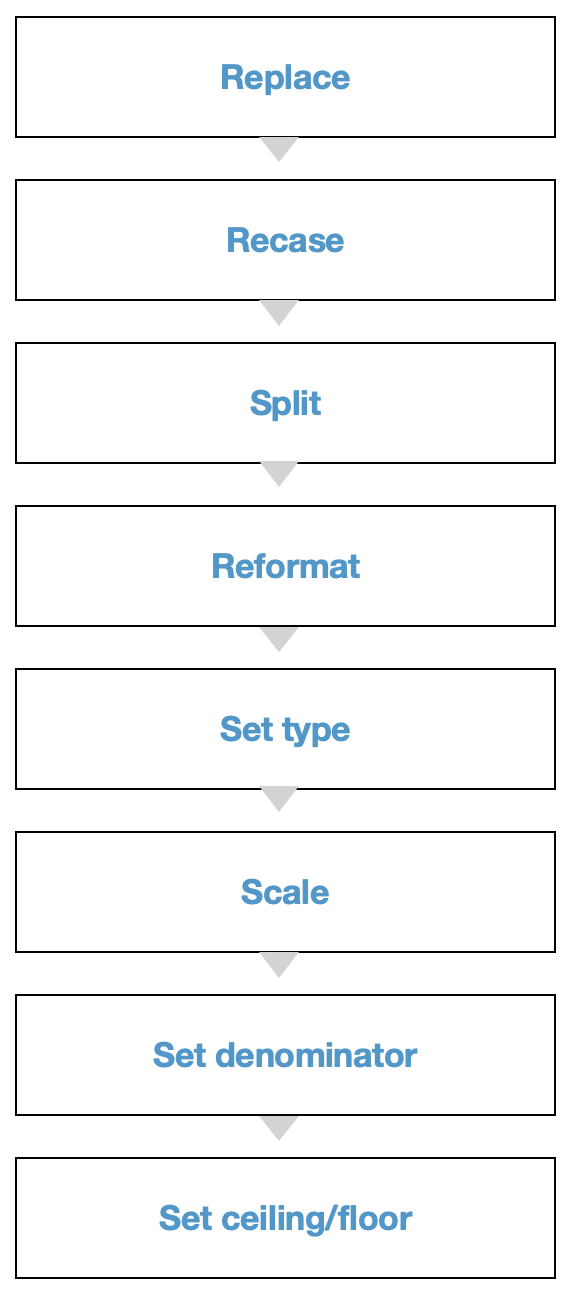
Protobi's order of operations
Copy/paste elements to create different views or apply attributes from one element to another
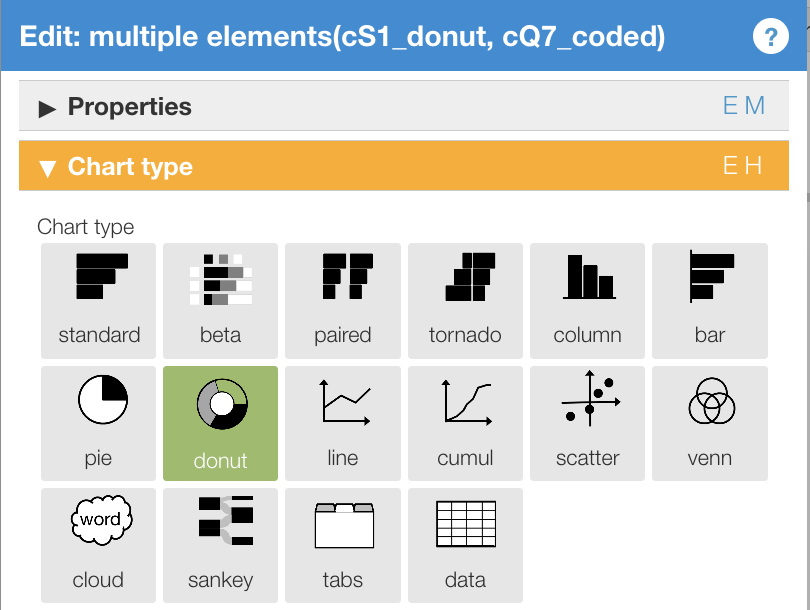
Edit multiple elements at once
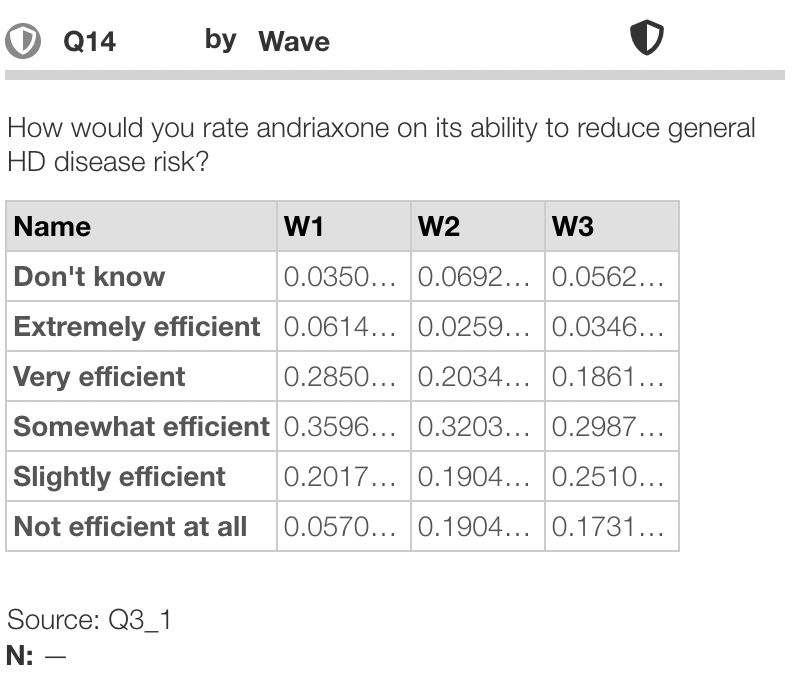
See and edit data for charts in table view